
IG: @frankdanielson66
We built Inukshuk Capital Management to serve the needs of clients looking for a unique approach – void of conflicts of interest, commission sales and pushed products. We began by putting our own money where our mouth is. With low fees and active risk management, we help families achieve financial longevity, that’s the bottom line.
Stay up-to-date on the latest developments by following us on LinkedIn here.
March 2022: Two Years
In this issue:
- Global Equity Markets
- Emerging or Submerging
- Europe, Australasia and the Far East (or yeesh)
- The S&P 500 – The Gorilla in the Room
- The S&P/TSX 60 – GO CANADA GO
GLOBAL EQUITY MARKETS
That escalated quickly. January was a not very nice introduction to the year 2022, if you are an investor. February was an unpleasant sequel for anyone on the planet, invested or not.
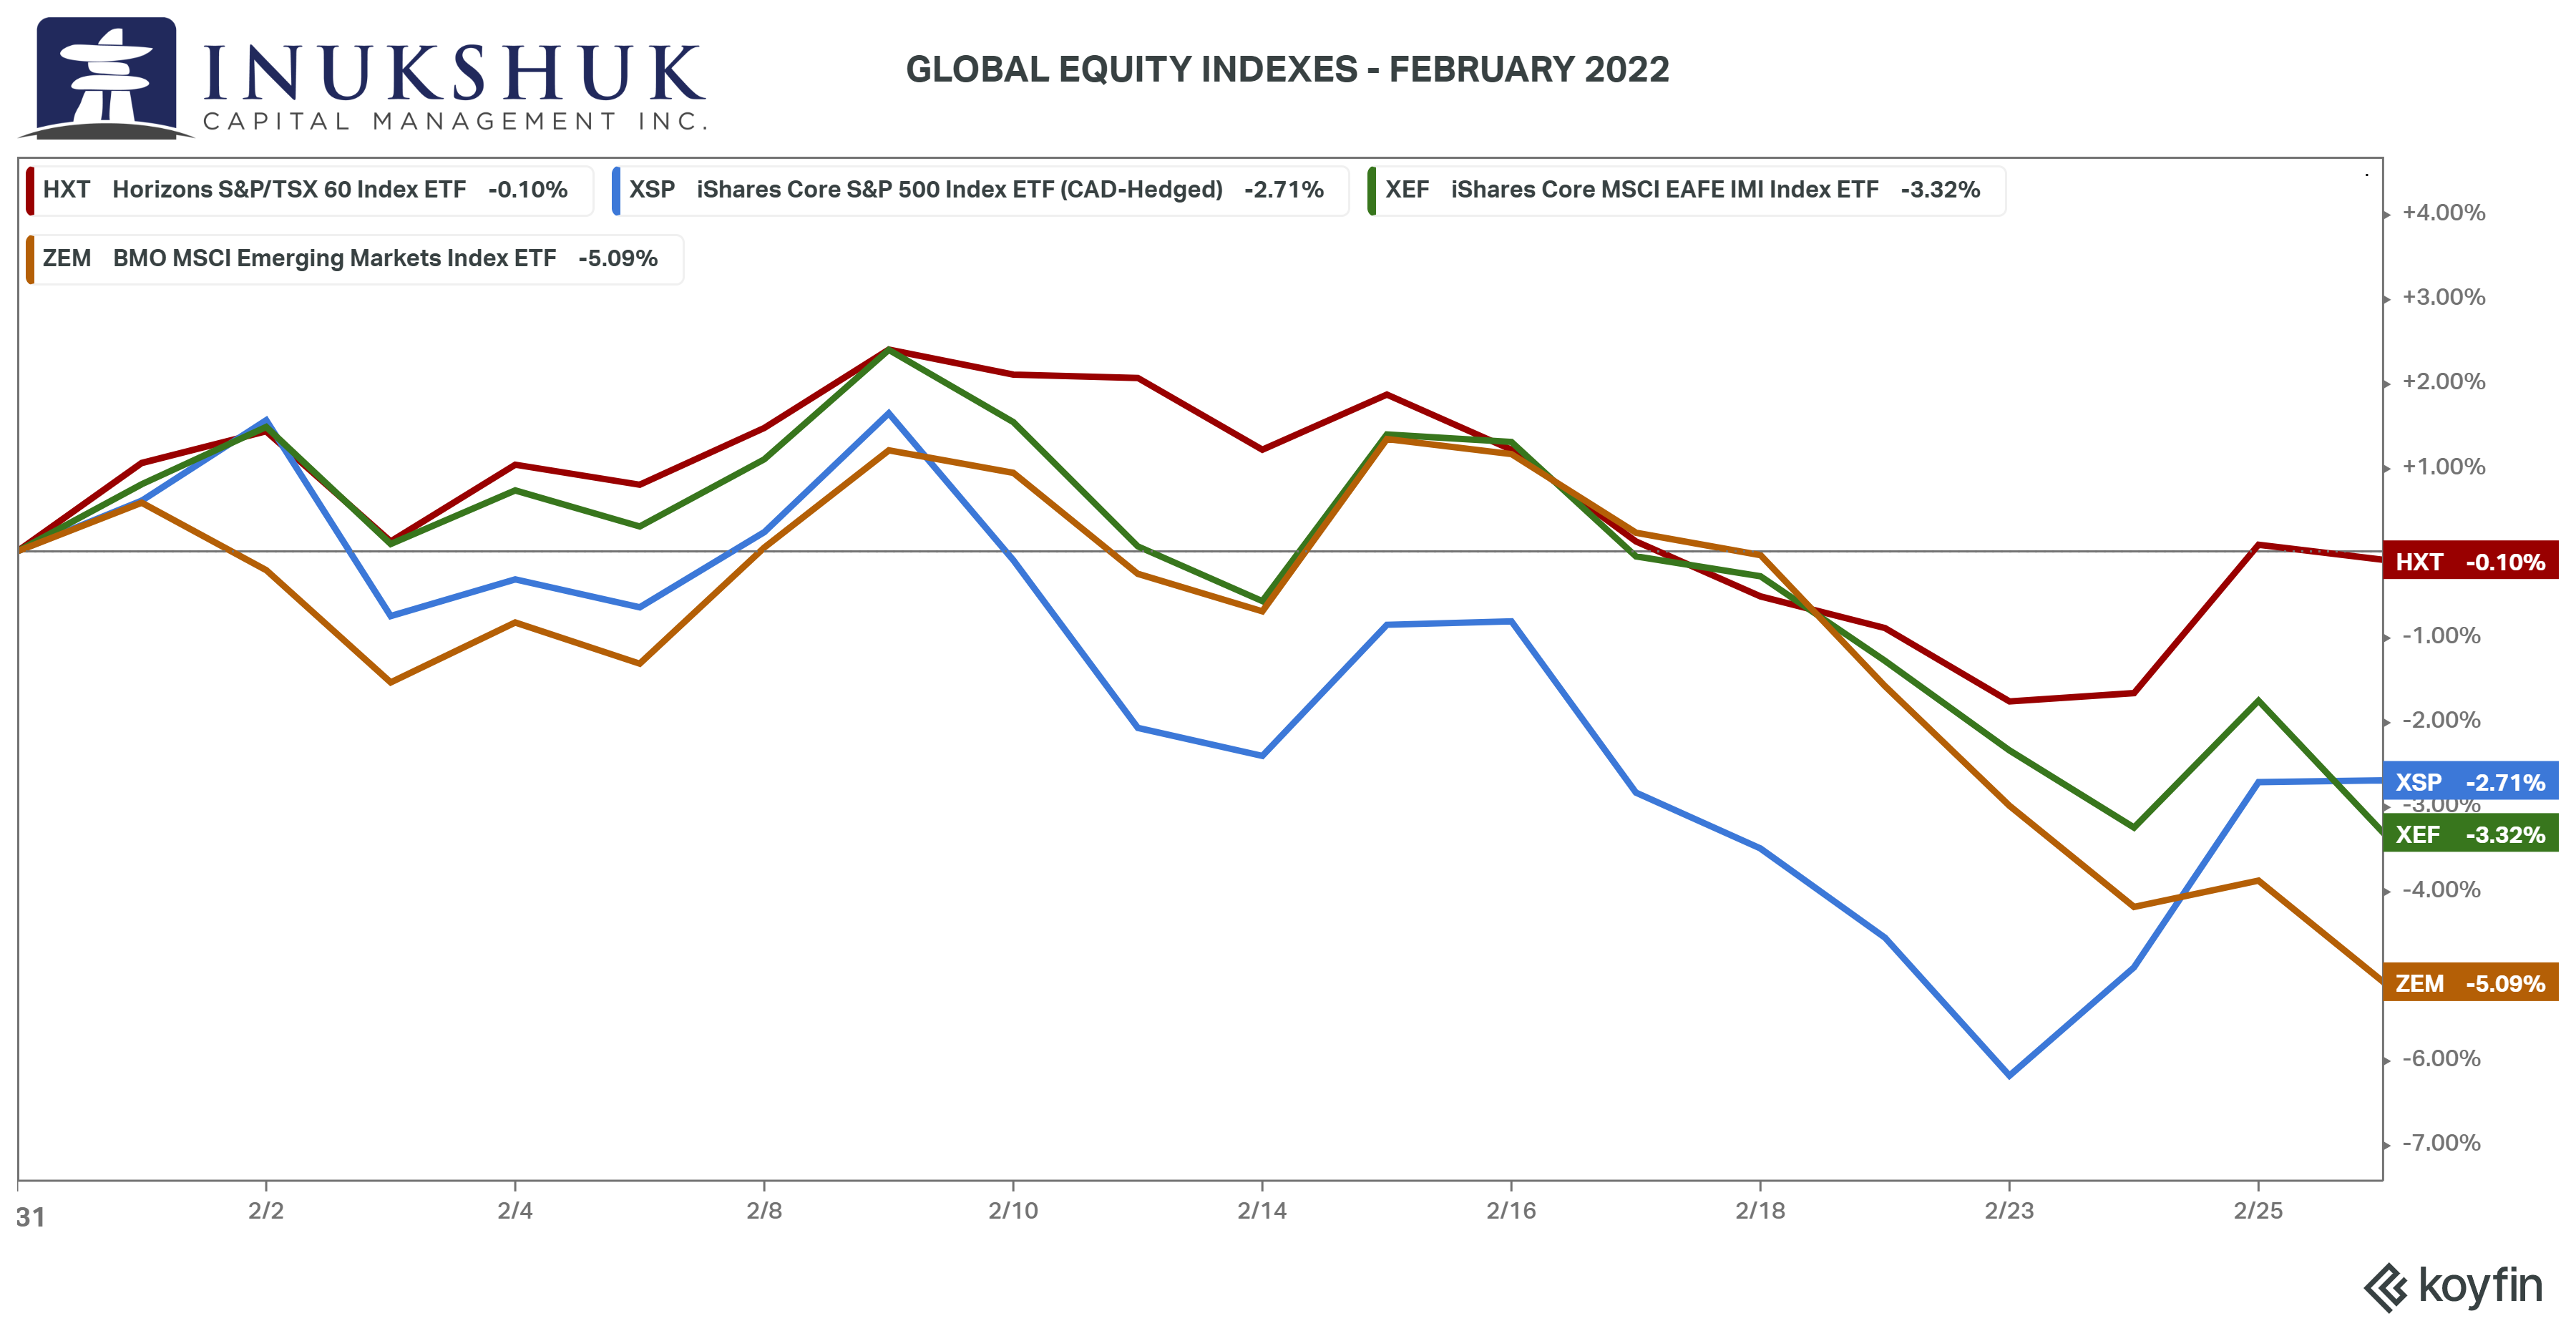
Emerging markets (EM) were hanging in there along with the S&P/TSX60 over the first four weeks of this year, but not so much over the next four weeks and closed down 5.09%. MSCI EAFE (Europe, Australasia and Far East) and the S&P 500 were competing for the mediocre medal of the month. In January, EAFE took the gold in that category by only falling 3.63%. The S&P 500 couldn’t even compete with a very un-mediocre loss of 5.27%. This month both ‘owned the podium’ of mediocrity, down 3.32% and 2.71%, respectively. And once again, the S&P/TSX60 was the clear winner of the losers with a loss of 0.10% – winning by only losing a bit.
Here’s what that misery looked like.
It could have been worse, considering a new hot war in Europe.
Usually, this section concludes with some brief observations of how our systems are positioned in these equity indexes. But considering all that has happened over the past two-plus years, it might be a good idea to dive in a little deeper.
If you would like to stay current on our measures of trend and momentum in the markets we follow, please click here
You might also be interested to know that ICM is proud to have been selected as the portfolio manager to manage a new mutual fund on behalf of True Exposure Investments Inc. Using our propriety systems this collaboration has developed the strategy driving the performance of the TruX Exogenous Risk Pool. You can read more about that here.
EMERGING OR SUBMERGING
Our systems have been negative EM for quite some time despite an apparently false moment of optimism in December. ‘Quite some time’ in this business goes all the waaaay back to July 2021. Note: machines don’t have emotions, so this anthropomorphic description is merely to convey a story. Prices don’t have emotions either, nor does our process. But it doesn’t always feel that way to us. Honestly.
Here’s a tale of the Emerging Markets over the past three years – first in a picture and then in words.
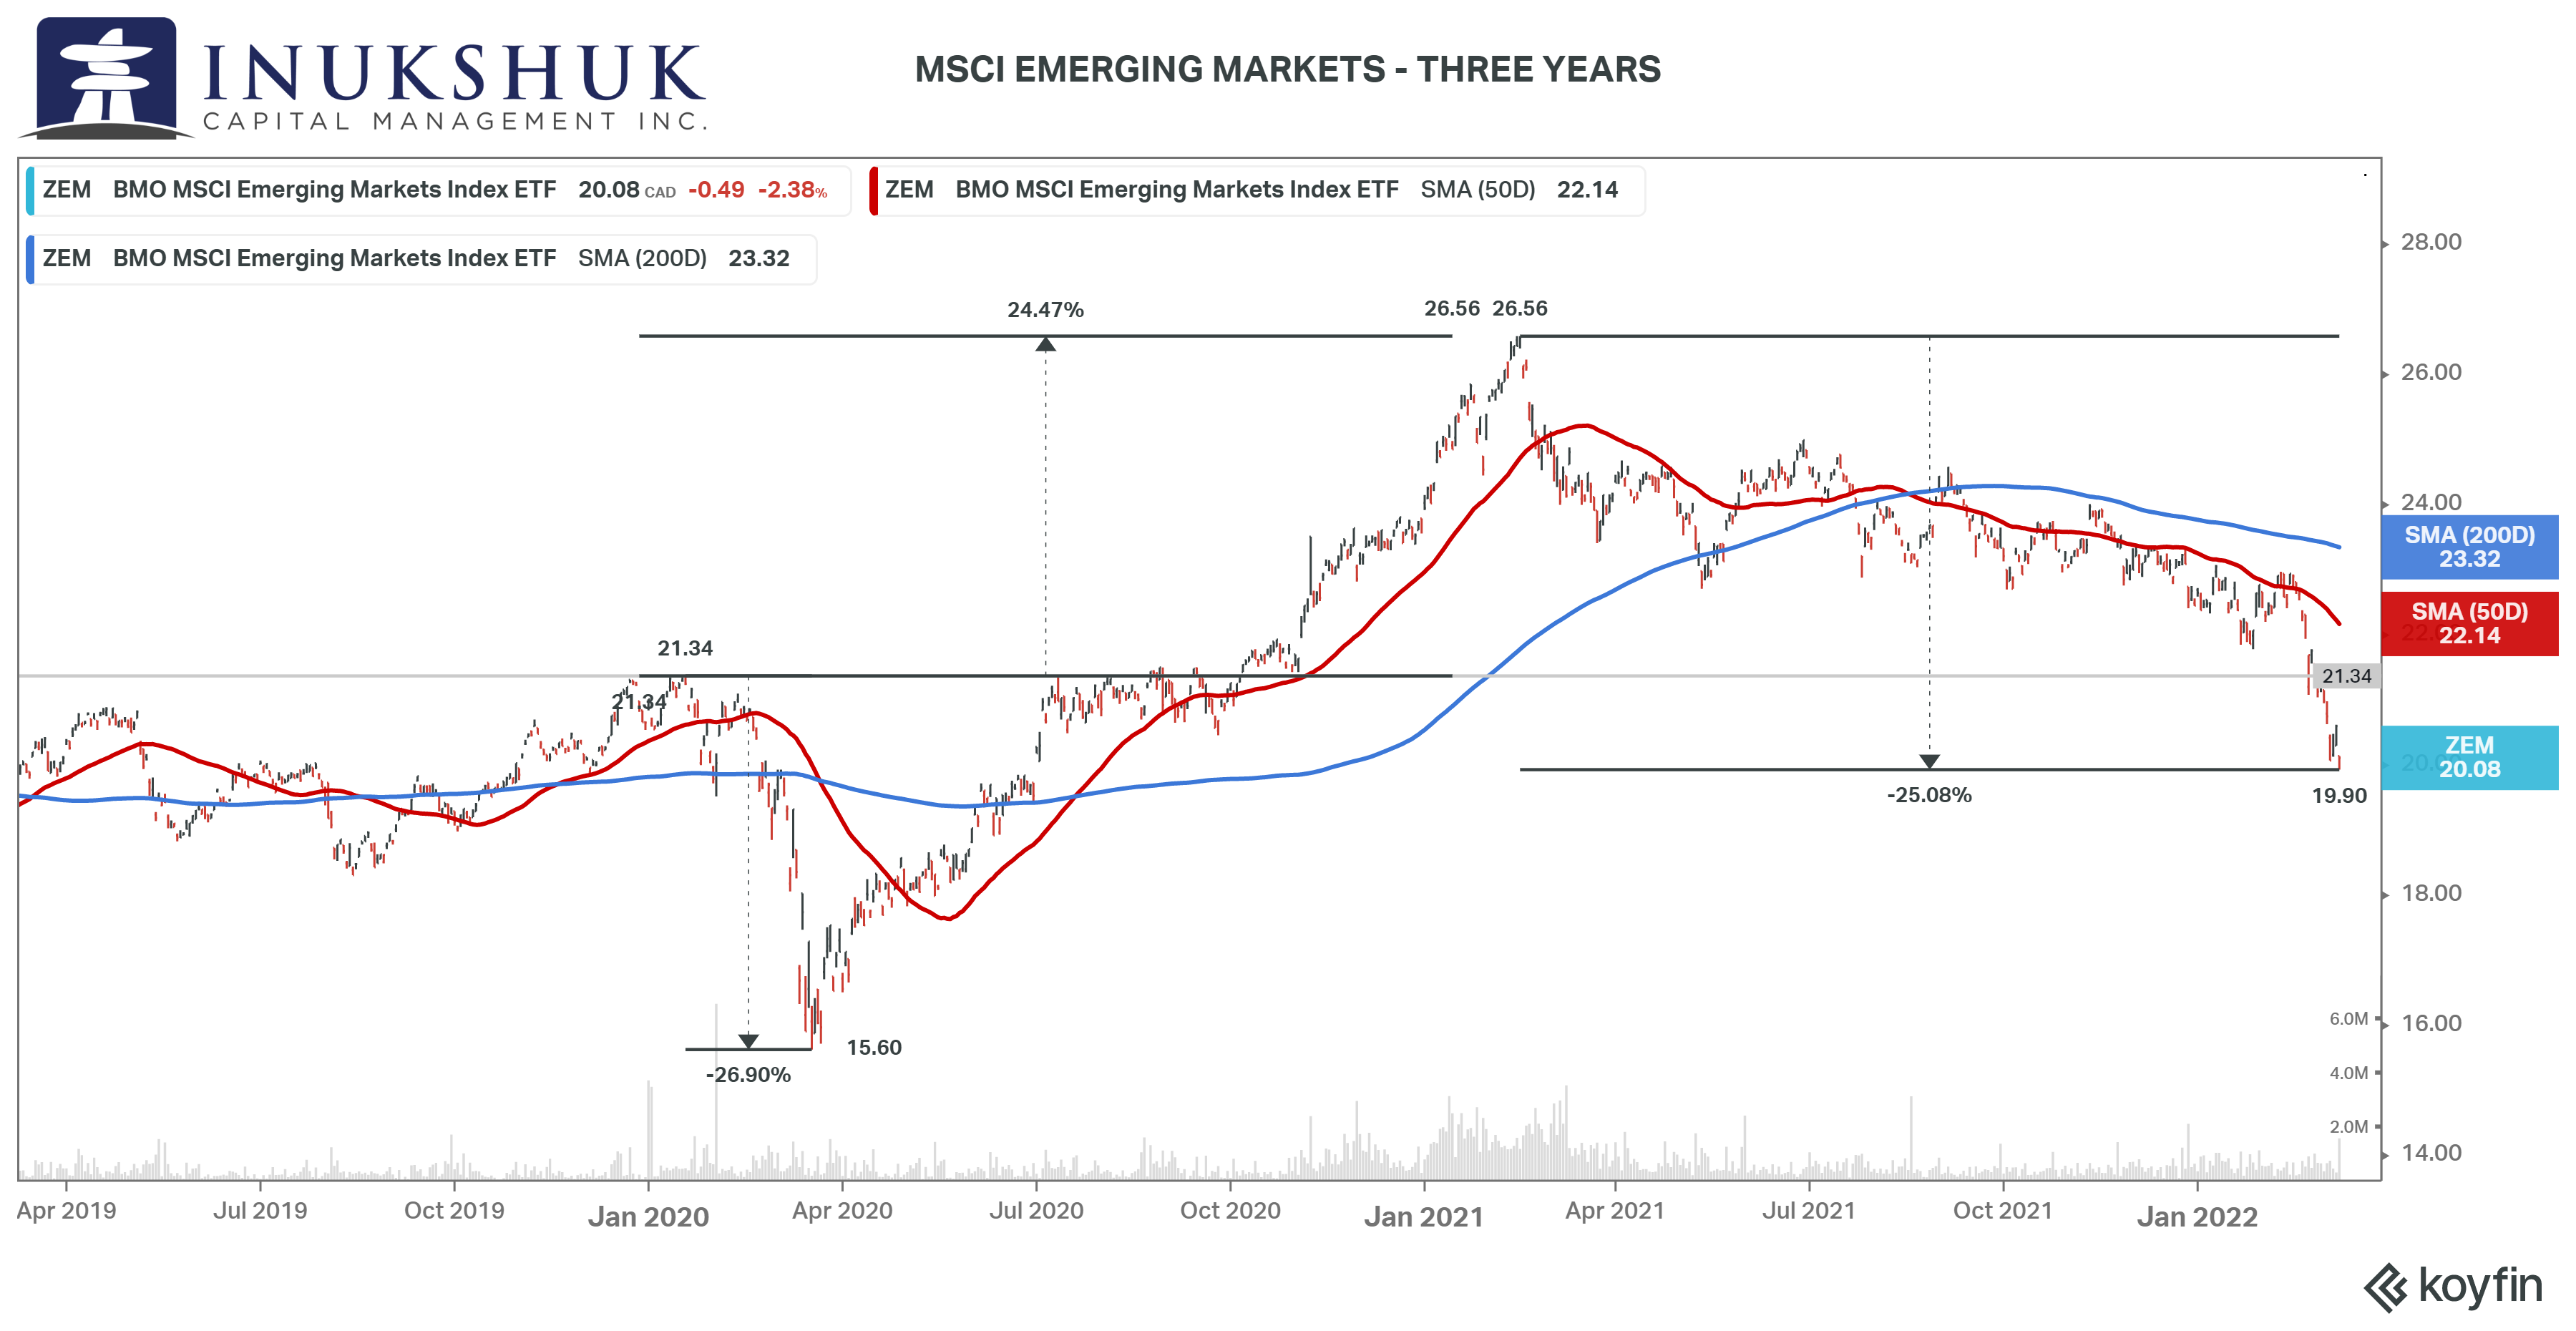
This is one of the best examples, in recent memory, of the quirky things that can happen in markets. In this case, the symmetry of these moves is remarkable.
If you were lucky enough to buy this index at the high in January 2020 – not the all-time high, because that happened two years earlier (January 2018) – you might have been a little disappointed when, two months later, you had lost 25% of your money. Comforting, however, was the reassuring, well-documented and widely-broadcast view that you’re in it for the long-haul and it’s the best strategy to stick to your guns and wait it out. You didn’t panic and that worked.
Less than a year later, after suffering a mild cardiac event and white-knuckling it through the Pandemic Panic Low (PPM™), you were up 70% and managed to make back the same amount that you lost because, wow, EM rallied 25% from where you bought it. But only if you sold at the tippity-top high, because from that high, you’ve lost another 25% (how weird is that, eh?) and are now underwater from where you initially bought said index. What to do? This game is easy… said no one.
EUROPE, AUSTRALASIA and the FAR EAST (or YEESH)
If you’ve been reading these notes for the past year or so, you would know we haven’t owned MSCI EAFE since February of last year. The risk-reward setup in our systems leaned heavy on the risk-side of things. That was a good call, even though it didn’t feel that way into the end of last year and then a few weeks later. The index is now down 18% from its recent highs in September. Let’s have a look at a longer timeframe. Here is a total-return chart of the U.S.-listed MSCI EAFE ETF, EFA, going back to 2017.
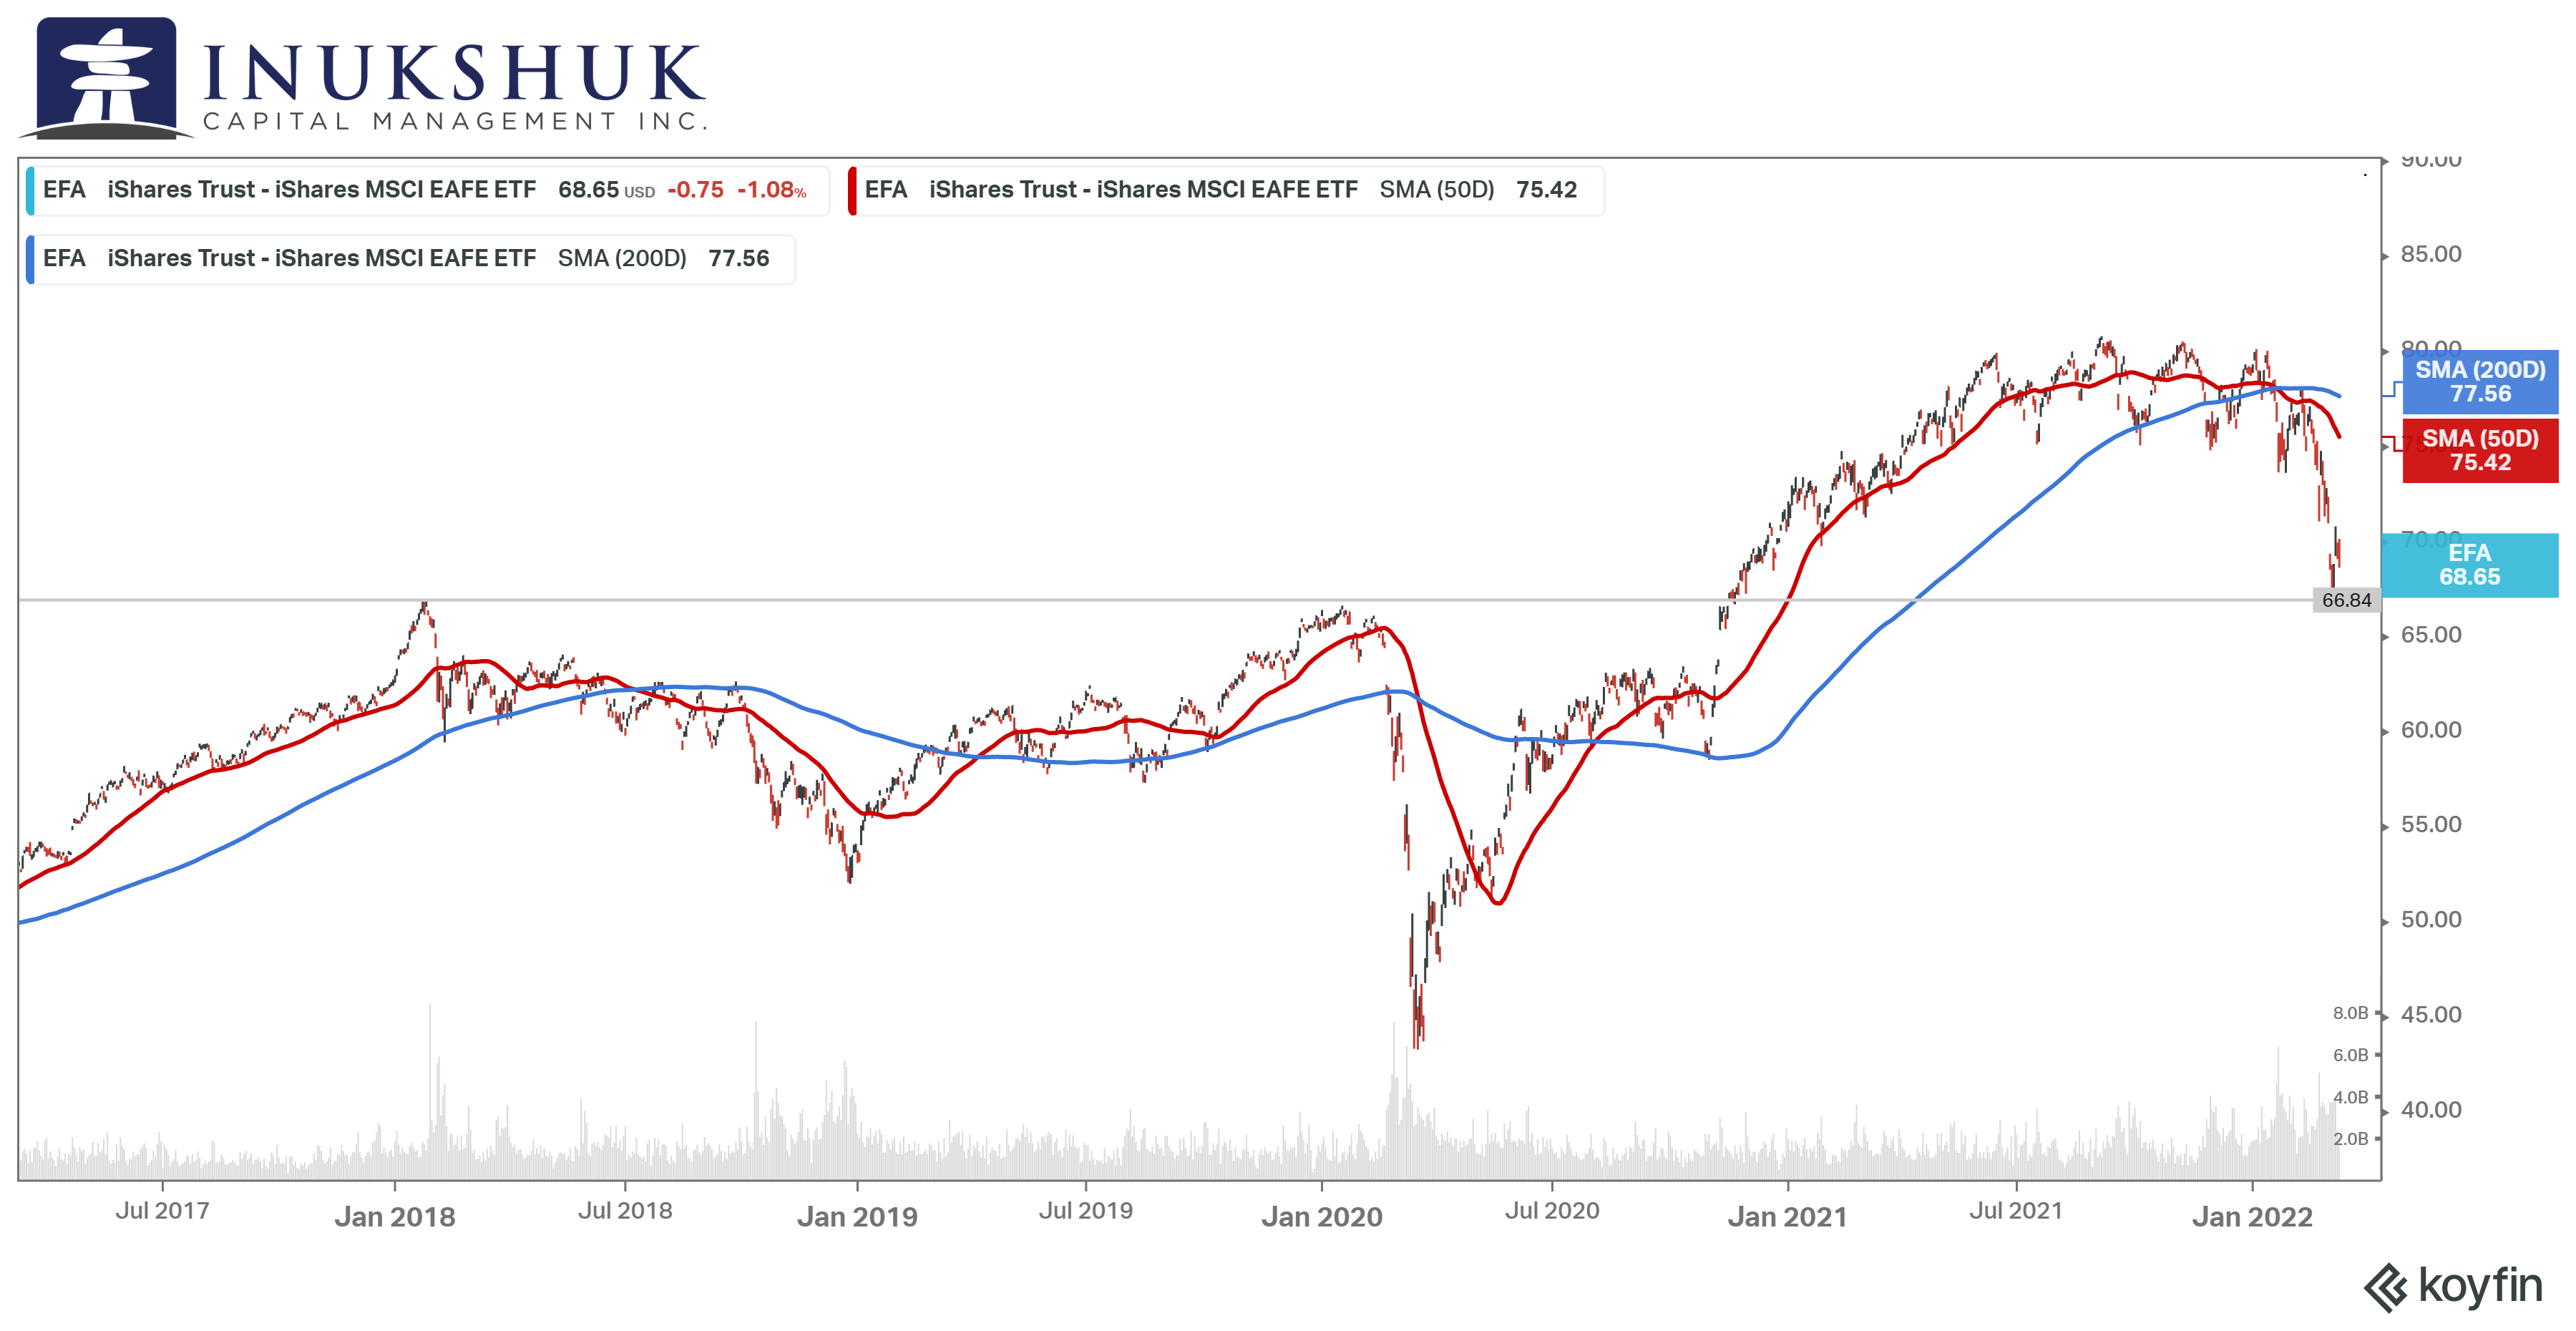
A total-return index means that every dividend received is automatically reinvested in the index. In other words, it is a representation of what an investor could earn over time if there were no costs and perfect execution. This index represents all the developed market equity markets outside of Canada and the United States. Most global asset managers invest outside of their local markets to benefit from diversification and trends in industry that may not be represented in their own regions. It sounds like a reasonable investment thesis, but in this instance it hasn’t been working out so well for portfolio managers in North America. This is important, because while most Canadians can see what the Dow or the TSX did on any day, those indexes are not representative of what is going on around the globe. A local investor might wonder what the point is in investing outside of what they see every day. It is a good question.
THE S&P 500- THE GORILLA IN THE ROOM
The Dow Jones Industrial Average is something that is on the top of the list of media broadcasts, every night. ‘The Dow Falls 600 Points’ is something anyone who listens, reads or watches mainstream media has seen or heard before, regardless of whether they care or not.
The problem is, is it isn’t a very good index to measure anything against. It should probably be ignored. The reason for this observation: the index performance is based on the price of any one of its constituents. It is price-weighted. But the price of a stock doesn’t mean anything, if you don’t know how many shares exist.
The Coca Cola Company (KO) has roughly 4.3 billion shares outstanding and its closing price as of this writing was $57.92. The Walt Disney Company (DIS) has 1.8 billion shares outstanding and its closing price as of this writing was $316.70. These companies are both included in the Dow and are close enough in overall market capitalization to illustrate the problem.
If both companies release earnings after the close and both surprise the street and they both go up 3%, the contribution of each company to the Dow’s performance that day will be distorted because the price of DIS is higher than KO. DIS will be up $9.50 and KO will be up $1.73. DIS will contribute more to the Dow than KO, simply because it started at a higher price. It makes no sense. It might’ve made sense 137 years ago when U.S. public companies would issue shares with a $100 ‘par value’, but that is not the reality today. But it is a reality for portfolio managers when they are talking to clients about performance because proper asset allocation is not dependent upon the price of a stock, a bond, or an ETF.
The S&P 500 was supposed to be the solution to this problem. It is market capitalization weighted. So, in theory, if both DIS and KO are up 3%, their contribution to the index performance will be roughly equal since they are close in market capitalization. The issue with an index constructed in this manner is that both of these giant icons of American industry represent only about 1.2% of the index. Compare this to two other icons, Apple (AAPL) and Microsoft (MSFT) that comprise more than 12% of the index. You can see the problems here
We do not invest in individual stocks. We invest in broad market and sector indexes. The things people see in news updates. And we don’t invest in the Dow for the above reasons. As readers, a question you might be asking at this point is: what does any of this have to do with me?
Here’s the answer.
A core holding of our portfolios is the S&P 500. It is also one of the four global indexes we manage actively. This means we can have a 100% allocation to any one or all four of those at any time or 0%. This active component of our portfolio construction is weighted based on its performance characteristics relative to other asset classes in the overall model. The ‘passive’ component of our process is comprised of the S&P 500 and the S&P/TSX 60. The thing is the S&P 500 now represents $40 trillion in equity. That is more than 40% of the entire planet’s equity market capitalization. And more than 20% of that is comprised of five companies: Apple, Microsoft, Amazon, Google and Tesla (Tesla?). We might have a problem here, Houston.
Maybe that wasn’t the best answer. But the idea is, for various reasons including index construction, stock pickers and index investors are being compared to things that either haven’t made sense or are progressing towards making no sense. Good times.
Here’s a chart showing the performance of SPY over the past 12 months, the largest equity index ETF in the world.
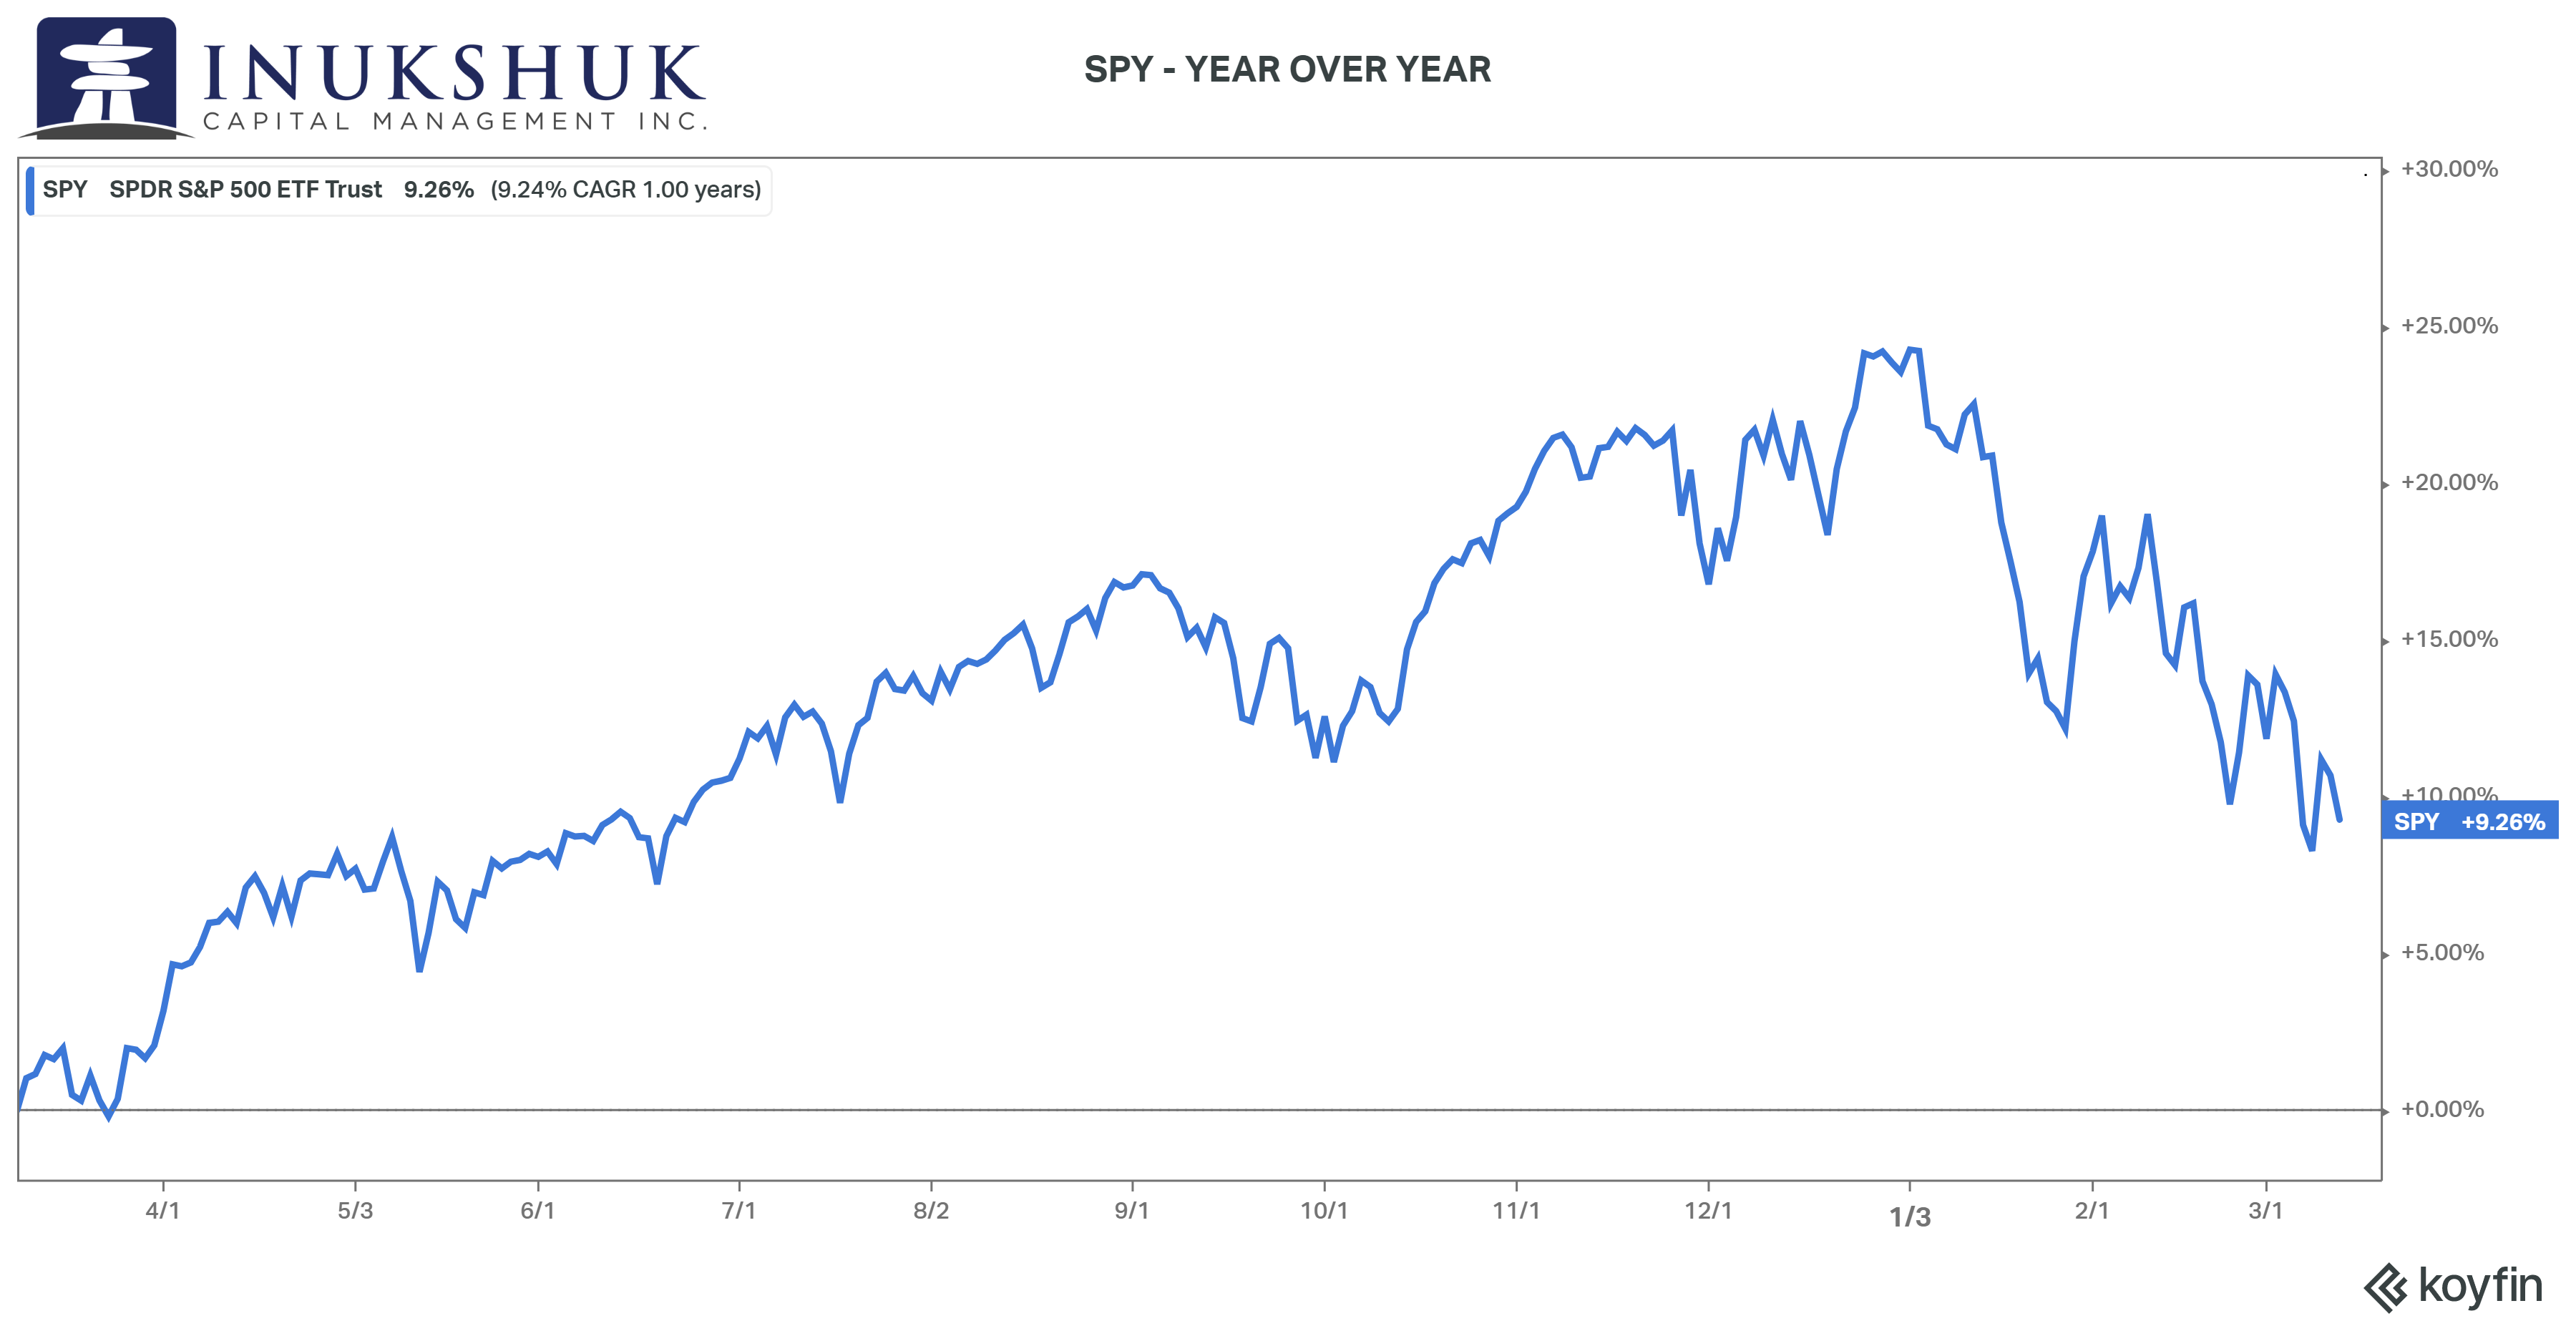
Once again, this is the total return of the ETF. That’s a decent one-year return but note that the 2021 total return was 28%. It’s tricky.
THE S&P/TSX 60 – GO CANADA GO
The way people divide up time and talk about returns as in, ‘this year or that month’, gets somewhat tiresome. Starting points for any measurement have disproportional impacts on results. If you’ve ever read about the discipline of chaos math, you would be familiar with the expression: sensitive dependence on initial conditions. This is relevant because it seems humans are locked into a behaviour which creates their own initial conditions, and they are very sensitive to those conditions. It’s the same as looking at the change in the Dow and believing you understand what just happened today.
So, in the sprit of adhering to the standard of something that makes no sense, let’s look at the Canadian market year to date versus the S&P 500.
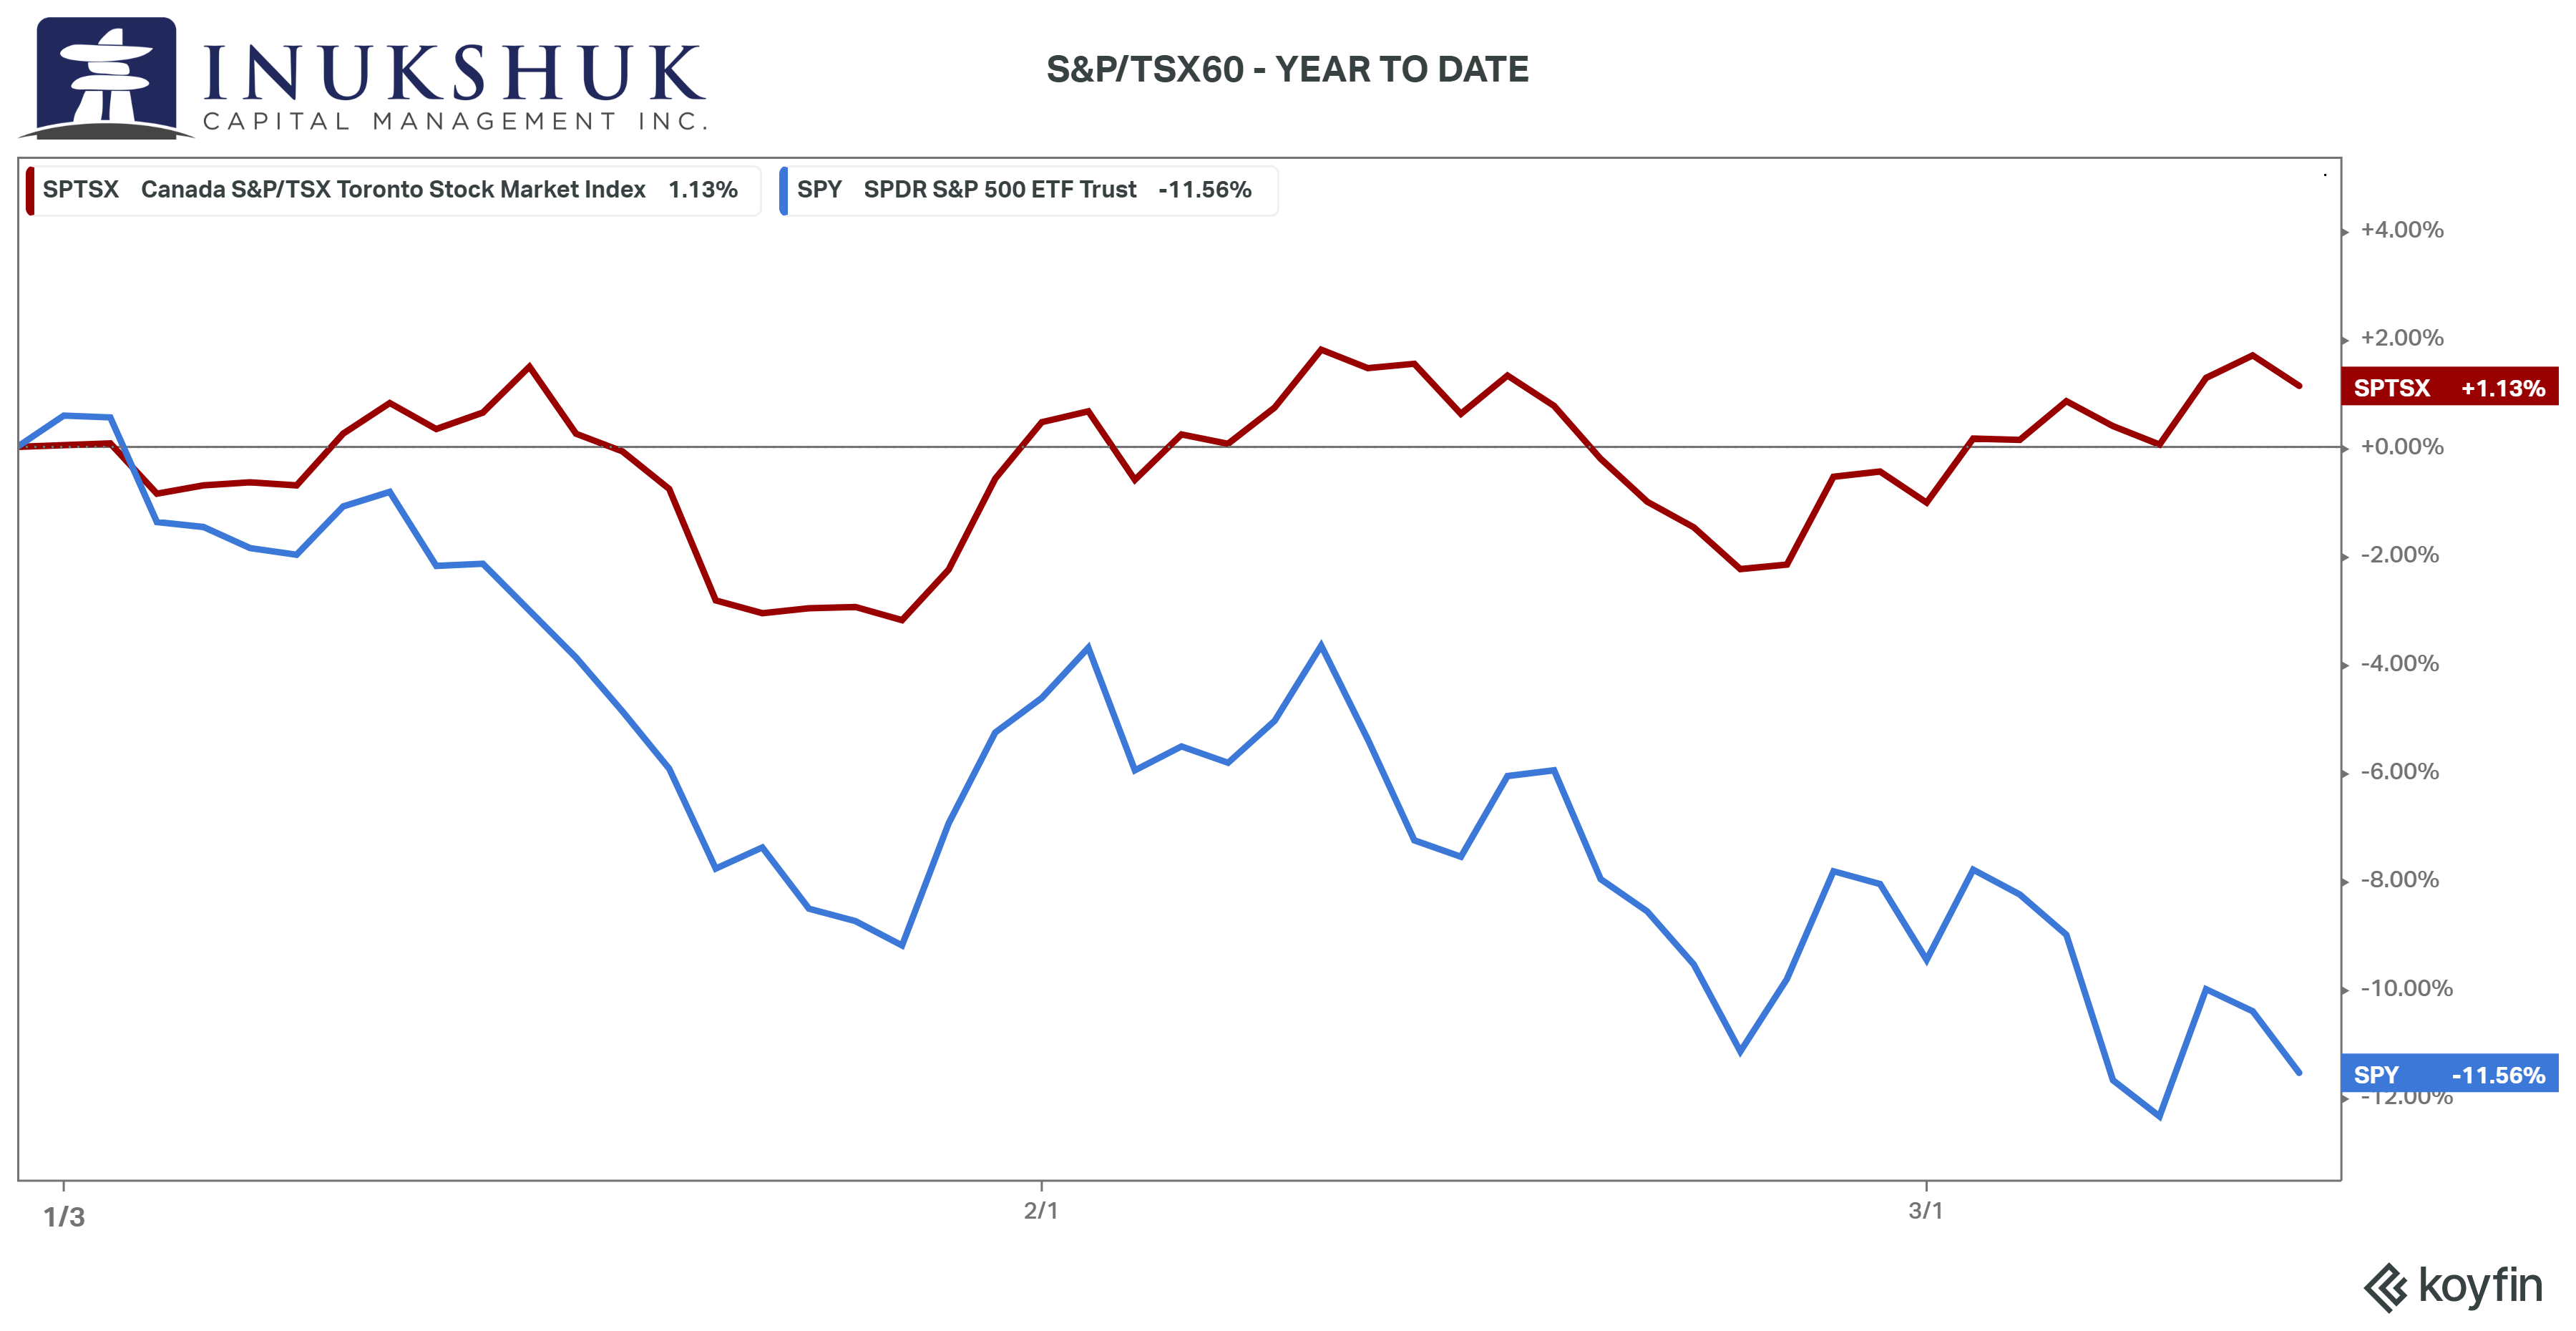
That’s a heck of a result by the Canadians. On the year, it is not just winning by losing less, but is actually not down. How is this possible? Should the premise of diversification across regions be revisited? And how is that supposed to happen – by market capitalization, country, or just what exactly?
WHAT WE ARE DOING
The partners of Inukshuk have been doing this for a very long time and have experienced many different investment environments and quite a few complete surprises – both on the up and downside in the investment equation. In past notes the idea of the death of asset allocation has been discussed. As in, does a mix of stocks and bonds matter anymore?
The foundation of our investment process, based on decades of experience and quantitative research, supports the idea that diversifying across asset classes is necessary, but not good enough. Strategies must be part of the mix. We do that and continue working on methods to improve our systems to the goal of achieving good risk-adjusted results.
An interesting aspect of investment management that’s evolved over the past decade or so is the ability to invest in stuff that is not easily classified in a traditional manner. So, take the above chart and add some things we own in the asset mix. Is bitcoin an asset class unto itself? How does a volatility-selling strategy enhance the overall returns of our portfolio? And while gold may be a currency, a commodity or something else, our research and experience points us in the direction of it being an asset class in itself and a valuable (but not always reliable) addition to a portfolio intended to generate steady and consistent long-term returns. To reiterate, this is a year-to-date chart. We don’t actually look at returns in such a short timeframe as being meaningful to our process, but that is the game we are in when compared to other asset managers.
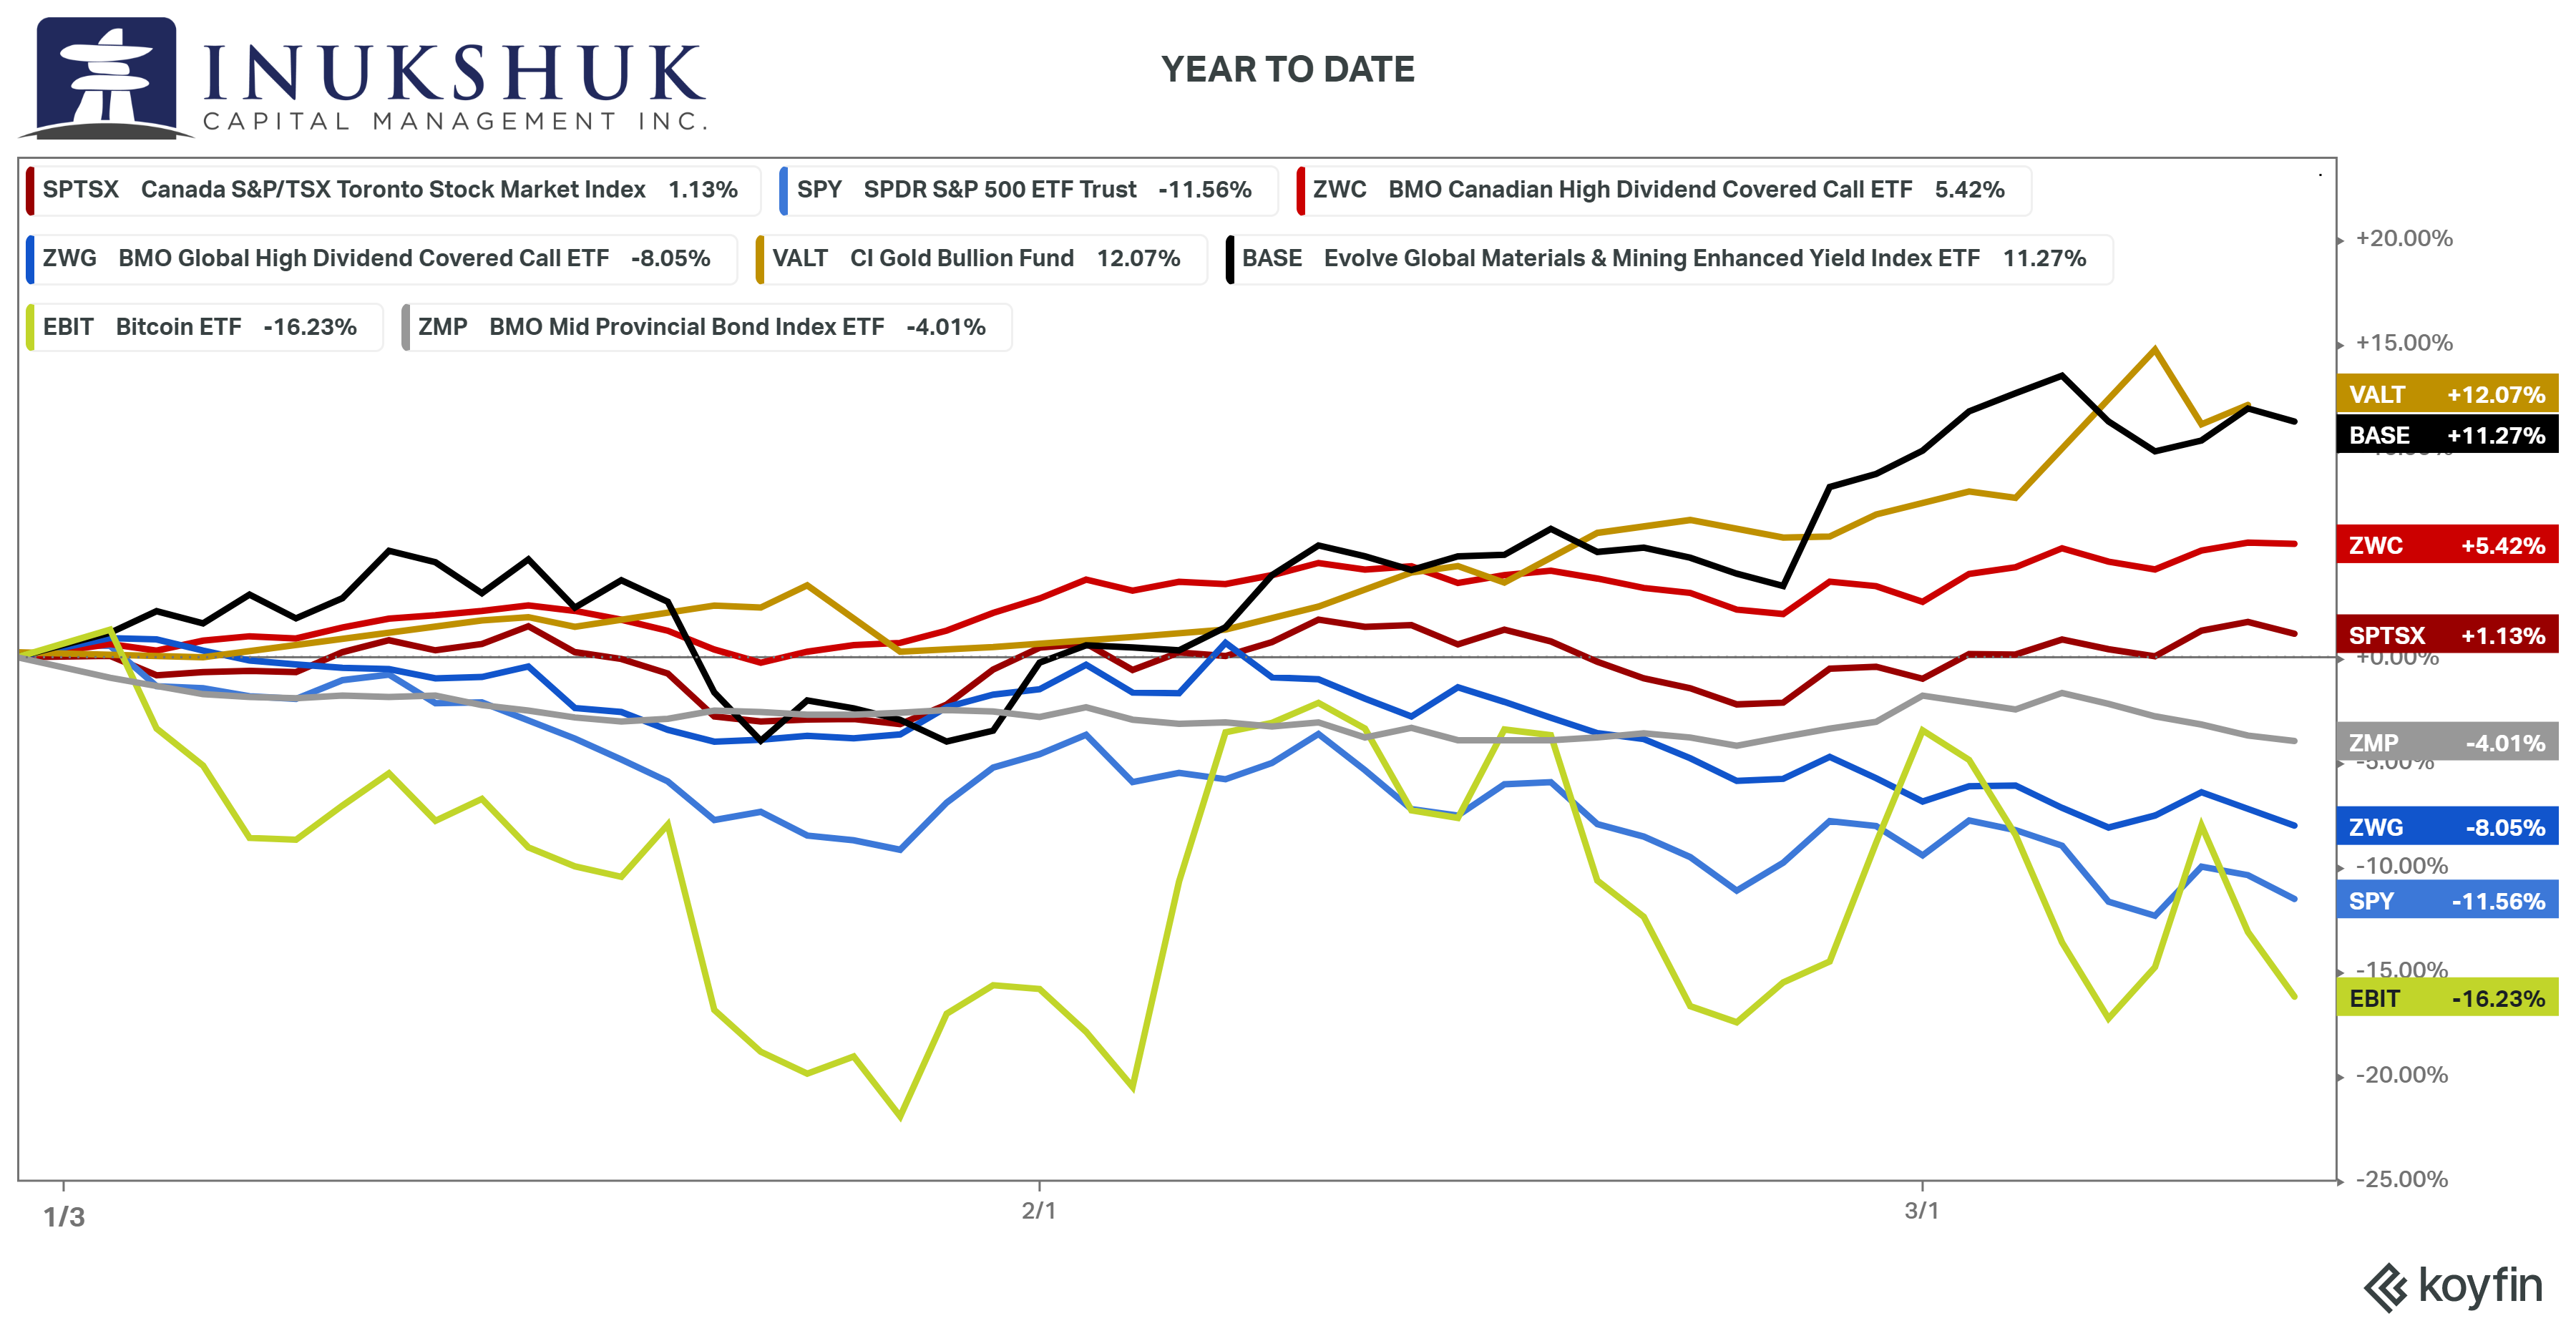
We own all of these ETFs. Some of these things that didn’t really show up and perform last year, or compliment the diversification requirement of the asset mix, are coming out of the 2022 gate pretty strong. Others, like bonds, continue to drag. This is part of the diversification process that should, over time, contribute to the total returns of our clients’ portfolios ensuring capital is protected and equity can grow.
No music this time. Not that music isn’t important, but world events suggest it’s probably not a good time to go down that road (considering the various kinds of music the resident music geek enjoys) – there’s too much cynicism and tragedy as it is.
Stay cool and keep breathing. You can read last month’s letter for assistance in that regard.
Have a question? Contact us here.
Challenging the status quo of the Canadian investment industry.