
At Inukshuk Capital Management, our focus is on building lasting relationships rooted in trust and collaboration. By focusing on active risk management and long-term value creation, we help families and institutions achieve financial sustainability.
Stay up-to-date on the latest developments by following us on LinkedIn here.

In this issue:
- Global Equity Market Performance
- Tacos?
- Sell in May?
- June So Far
- Wrapping Up
Global Equity Market Performance
May was the best month for stocks this year, exceeding the solid performance of January. The S&P 500 and S&P/TSX 60 rallied 6.1% and 5.2% respectively. MSCI EAFE was the third best at plus 4.1% with MSCI Emerging Markets lagging for the second month in a row, up 3.7%.

The S&P/TSX 60’s winning streak of four consecutive S&P 500-beating months was broken. The S&P 500 closed May roughly flat on the year and about 4% from its all-time high in February.
It is notable that since the U.S. election, when tariffs started to be recognized as a possibility, Canadian stocks have outperformed the U.S. by just over 7%.
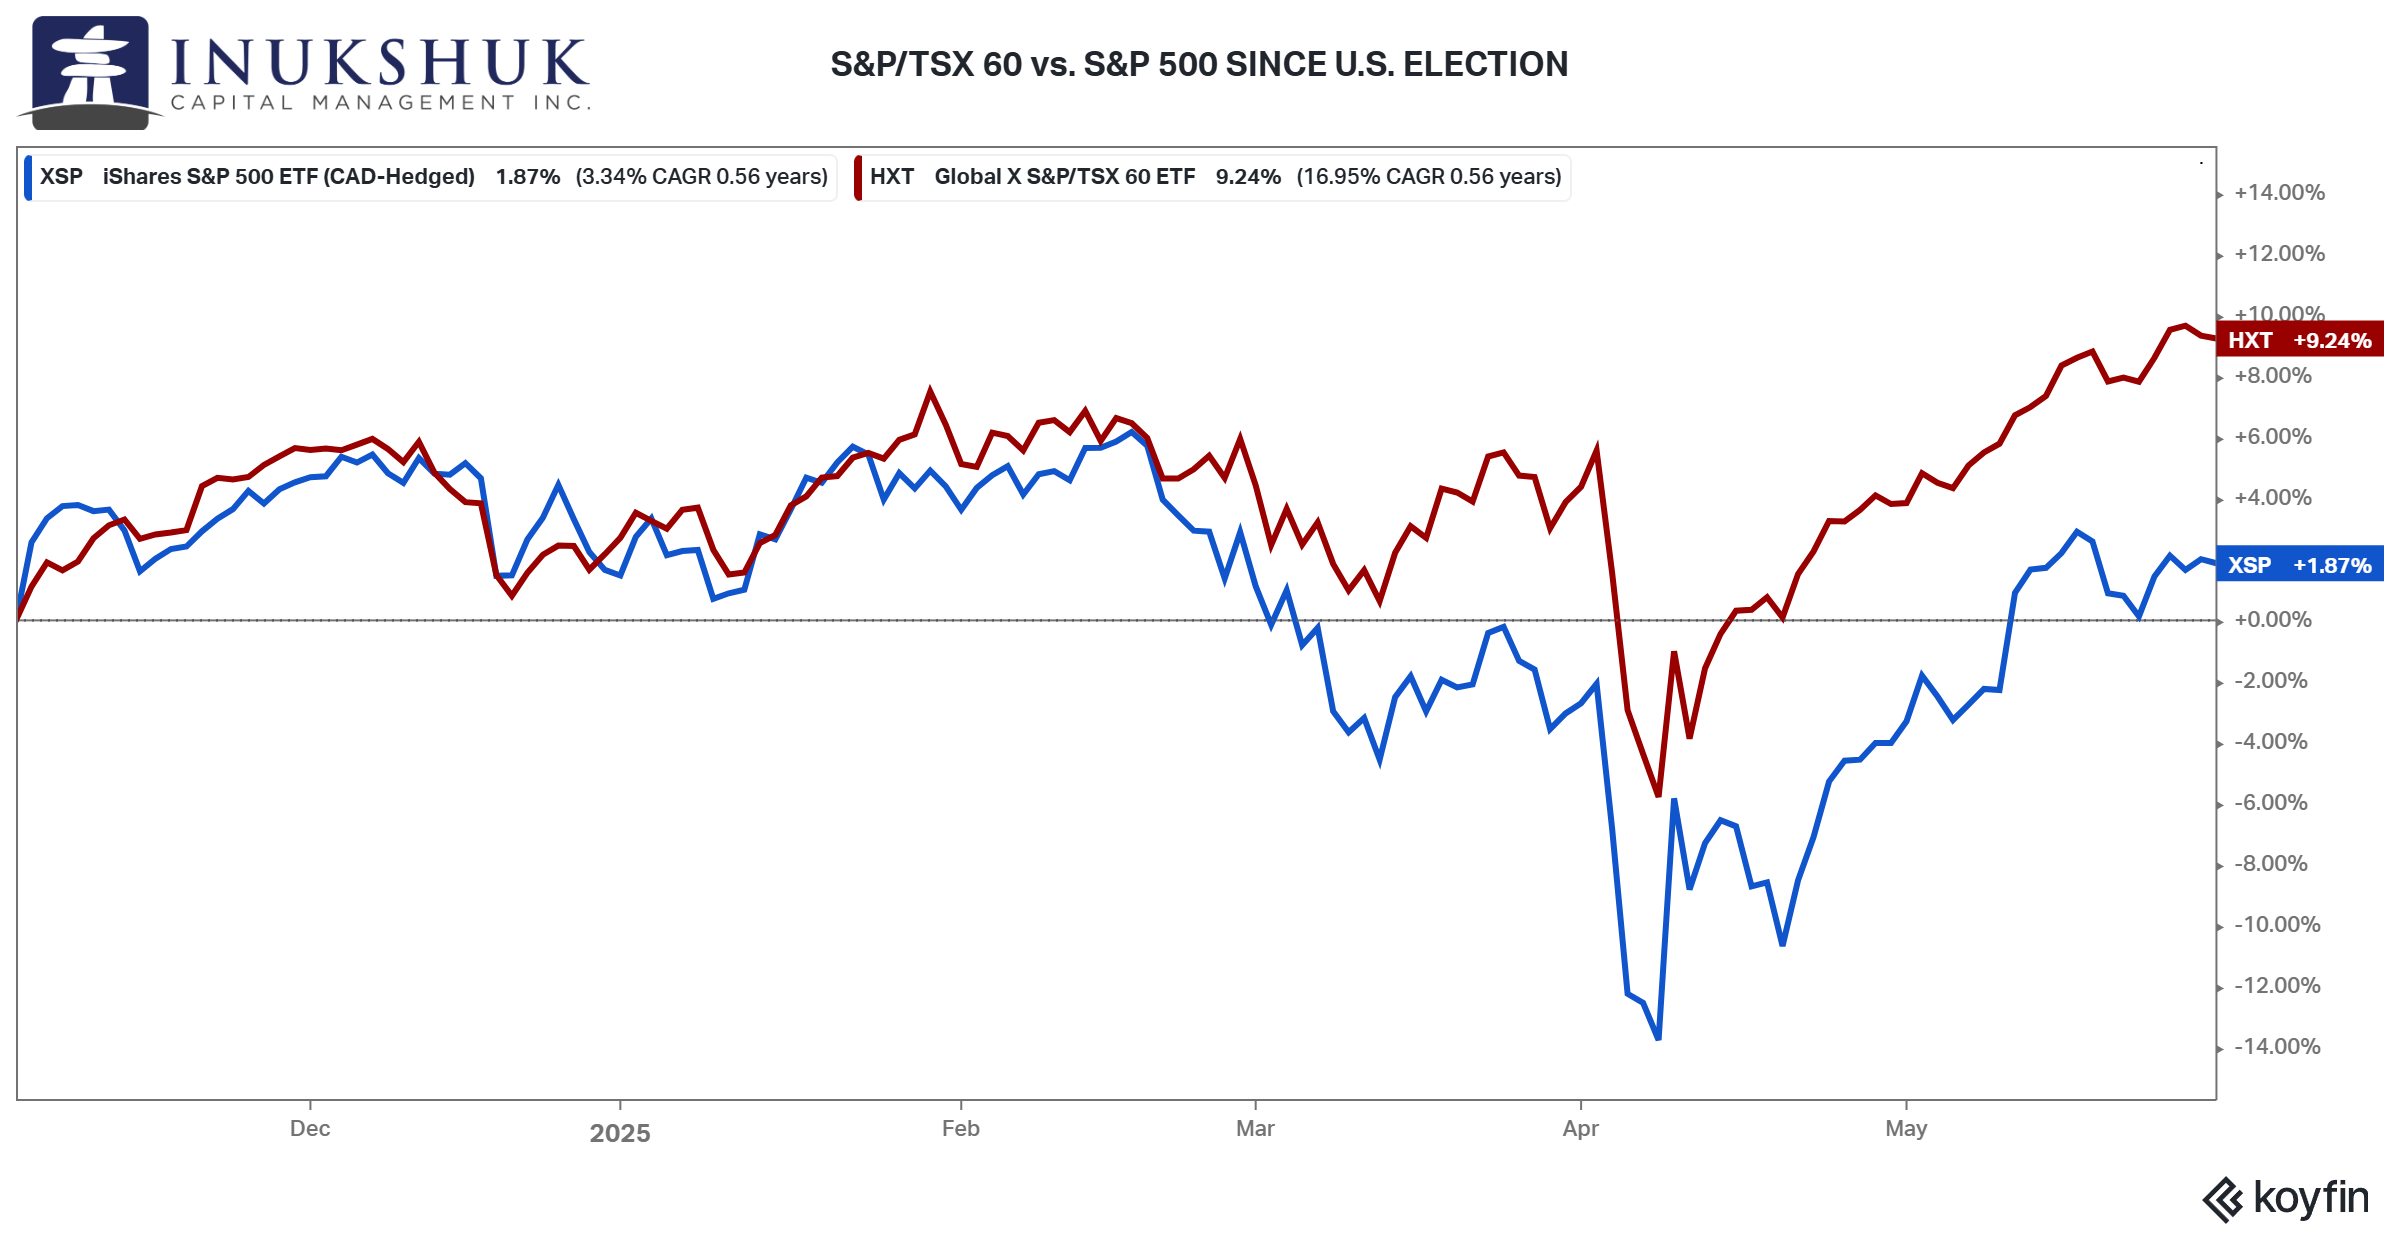
Even during the tariff tantrum of early April, it held the lead. Another great example – in markets, even if you could predict future events, you might still lose money.
As of this writing, the second week of June, our systems are neutral.
If you would like to stay current on our measures of trend and momentum in the markets we follow, please click here.
Considering the rally off the lows of early April this note will look at recent events, a new acronym (apparently, we need more) and the old market adage: sell in May and go away.
Tacos?
A new acronym has been adopted by some market participants, TACO. Which stands for Trump Always Chickens Out. When the president was informed about this he was not amused.
Markets have become accustomed to the bold statements surrounding tariffs, whether on social media or during interviews at the White House. Earlier in the year, a headline would cause a mini panic. Now, not so much because it seems the threats are always walked back.
Many years ago, around the time Long Term Capital Management imploded, the expression the ‘Fed put’ was used to describe the Federal Reserve’s actions in bailing out financial markets.
Before that, it was the ‘Greenspan put’. That was coined in 1987 after Alan Greenspan, the new chairman of the Fed, bailed out markets after the crash. It’s not clear how the same concept morphed into a generic term. Greenspan was the chairman until 2006.
TACO is similar, but different. More like a ‘Costanza’ manoeuvre.
So far, it’s holding up. The VIX, or ‘fear index’ which we covered in last month’s letter was down 25% in May as stocks rallied.
Buying every dip is being rewarded. Like most things in markets, it will work until it doesn’t.
This might be a good time to have a look at another popular market phrase: sell in May and go away.
Sell in May?
It’s not exactly clear when the expression ‘sell in May and go away’ started to become widely used, but it is probably more than 100 years old. Surprisingly, it is not attributed to Wall Street. That’s only surprising because recently, that’s where most market acronyms and phrases seem to originate. Maybe there’s more bull on Wall Street than in the City of London.
The original phrase was: Sell in May and go away, come back on St. Leger’s Day. That’s a reference to one of the oldest horse races in England dating to 1776.
Like anything associated with markets and human behaviour, things can be partly true. There is an argument that some of the weakest months of the year for equities are from May until October.
Since the horse race is mid to late September, we looked at the performance of the Dow Jones Industrial Average going back to its inception in 1896 from the end of May until the end of September. We will also compare these summer returns to winter.
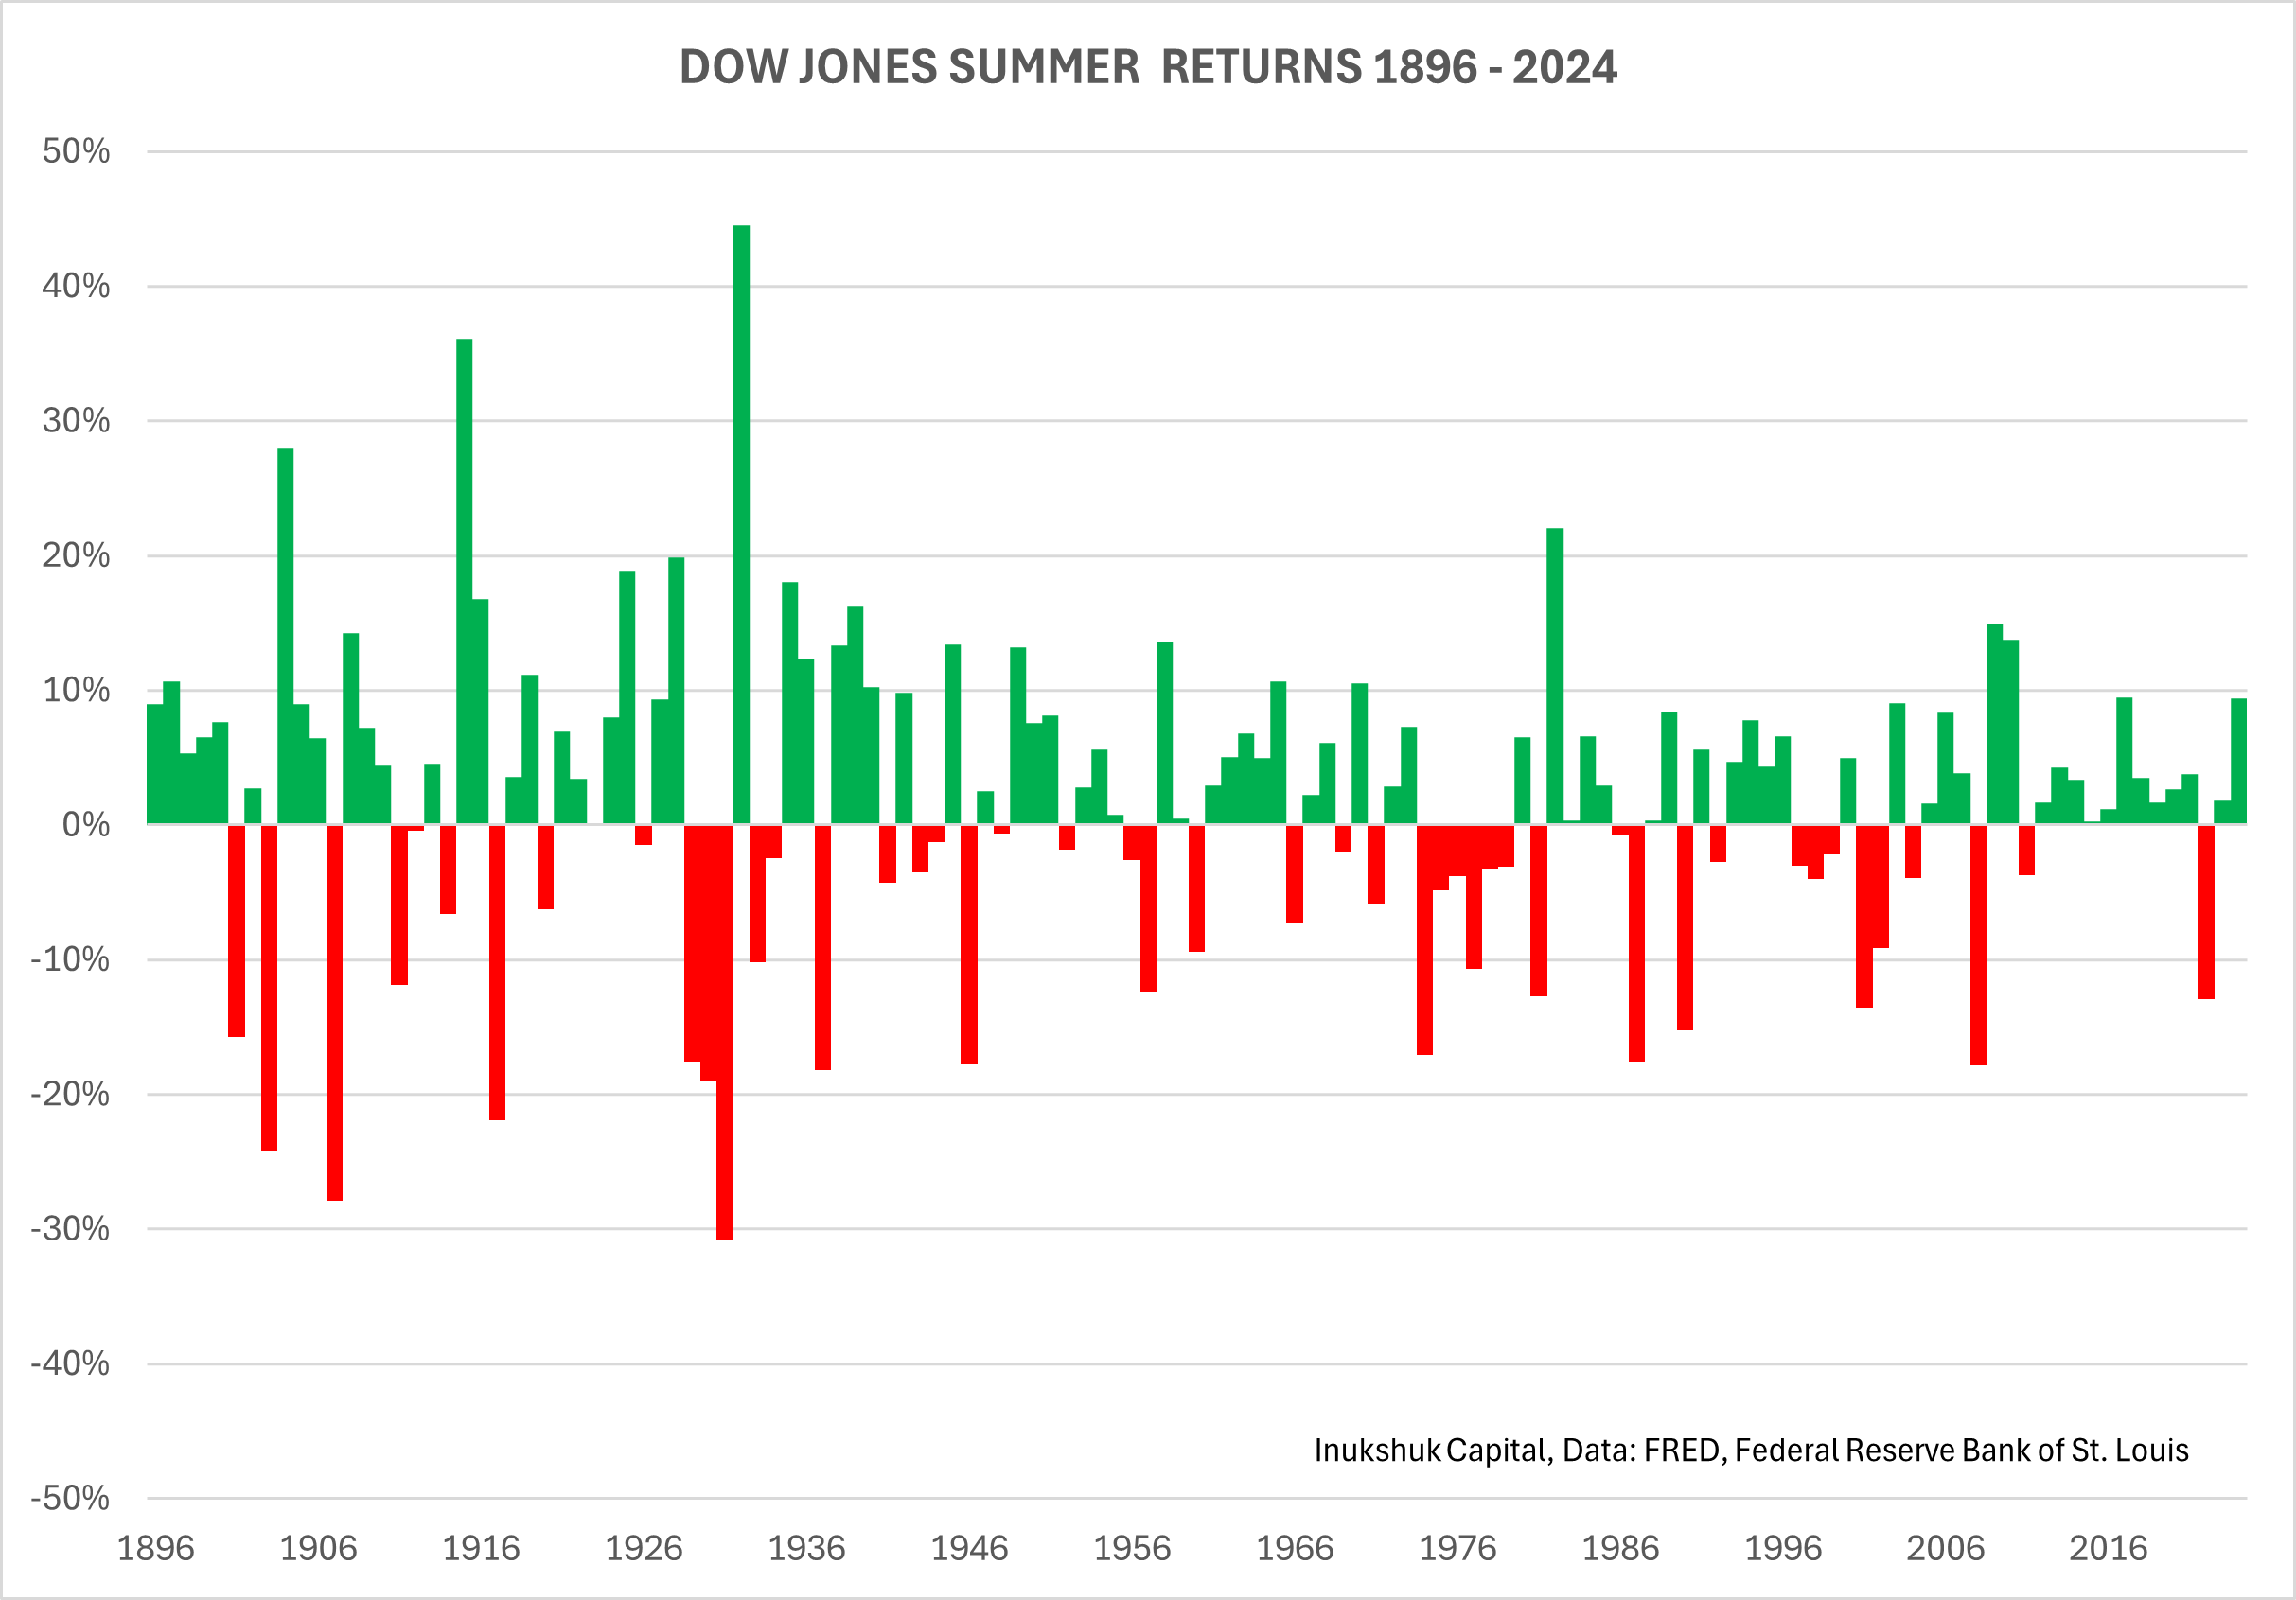
A simple test of this idea is to see if there are more negative than positive summers.
The answer is no – 46 of the 129 years of data were negative. That’s only 36% of the time. A 36% hit rate is not a good average, unless you play baseball.
For comparison, 32% of winters were negative. So, winter looks better than summer. It looks a little bit better if you consider that we are using twice as long a period to compare.
Another test is to see how much you could have lost. The worst summer was 1931 when the Dow was down 31%. The worst winter was 1932 at negative 59%. This looks close to being a tie. If the market is trending down, the longer you are in it the more you lose.
Now let’s look at this tactic compared to doing nothing but holding all year. If you could sell in May and buy at the end of September incurring no costs, you would earn the average winter return of 5.8% per year. The average annual return is 7.6%. That’s an opportunity cost of 1.8%.
As noted, there is some truth to the adage, but there are other considerations. In 1932, if you followed the strategy, you would have still taken a 59% hit. And then missed the 44% rally that summer.
As well, trading has costs and tax implications. And foregoing 1.8% a year while still taking similar drawdowns isn’t the kind of risk management strategy we are looking for.
Our systematic approach is not based on the seasons but on the strength or weakness of trends. Back in 2022 our systems and ‘sell in May’ lined up, but that was just a coincidence.
Maybe ‘sell in May’ will work this year. Stay tuned.
June So Far
This letter is written the second week of the month. The reason for that is we are trying to look at things from a broader perspective based on relevant events. Just recent enough, but not ‘live’.
Change seems to happen faster these days. A reader suggested a quick update before we hit send. At the risk of igniting some rapid market response here are some recent happenings.
As mentioned above, the market has adapted to the headline risk and reactions are more subdued.
Before last weekend there were some market jitters about negotiations over tariffs on goods from China. But nothing much came of it either way.
The S&P 500 was up more than 2% by Thursday June 12, but Israel bombed Iran after the close. Friday the 13th didn’t go well for stocks. Gold rallied 1.5% and oil 7.5%. A good confirmation for the those who suffer from friggatriskaidekaphobia.
Today, Monday the 16th stocks rallied back to where they were last Thursday as fears of an Iran-Israel war dissipated, despite Iran bombing Israel. This appears to be in response to the Dow Jones headline: A Battered Iran Signals It Wants to De-Escalate Hostilities With Israel and Negotiate.
See what we mean?
The G7 meetings kicked off in Alberta today. The FOMC meeting is Wednesday. The market is pricing a 99% chance that the Fed doesn’t change the target rate. Let’s see how this week goes. Depending, we may reconsider the intra-month update idea.
Wrapping Up
The TACO trade tactic may eventually fail. We don’t rely on headlines for investment guidance.
Sell in May is not a very robust indicator to develop a rules-based system to implement in the real world. Our models are based on trends and if those trends are considered reliable, we will hold a larger allocation to equity index ETFs than if they are looking unreliable.
If you’re of a cynical bent, you might respect the idea that the financial types in the City of London a century ago convinced everyone that it was wise to take the summer off. Clever.
We won’t take the entire summer off. It’s our job to pay attention to our clients’ portfolios, so that’s what we will do.
Go Oilers.
Have a question? Contact us here
Challenging the status quo of the Canadian investment industry.