We built Inukshuk Capital Management to serve the needs of clients looking for a unique approach – void of conflicts of interest, commission sales and pushed products. We began by putting our own money where our mouth is. With low fees and active risk management, we help families achieve financial longevity, that’s the bottom line.
Stay up-to-date on the latest developments by following us on LinkedIn here.
July 2022: Halftime Report
In this issue:
- Global Equity Market Performance – June
- North American Equity Markets
- Stocks and Bonds
- Global Equity Market Performance
- Historical Returns
- Nasdaq 100 Analogue
- Summing Up
- Health is Wealth
Before we comment on the month of June, it’s worth noting that the equity markets have had their worst start to the year in more than half a century. Not only have stocks pulled back in historical fashion, but bonds have also set records for their dismal performance – a double whammy for the typical balanced investor. This doesn’t mean everything will continue as it has, although there are some stats to back that up. Please read on.
GLOBAL EQUITY MARKET PERFORMANCE – JUNE
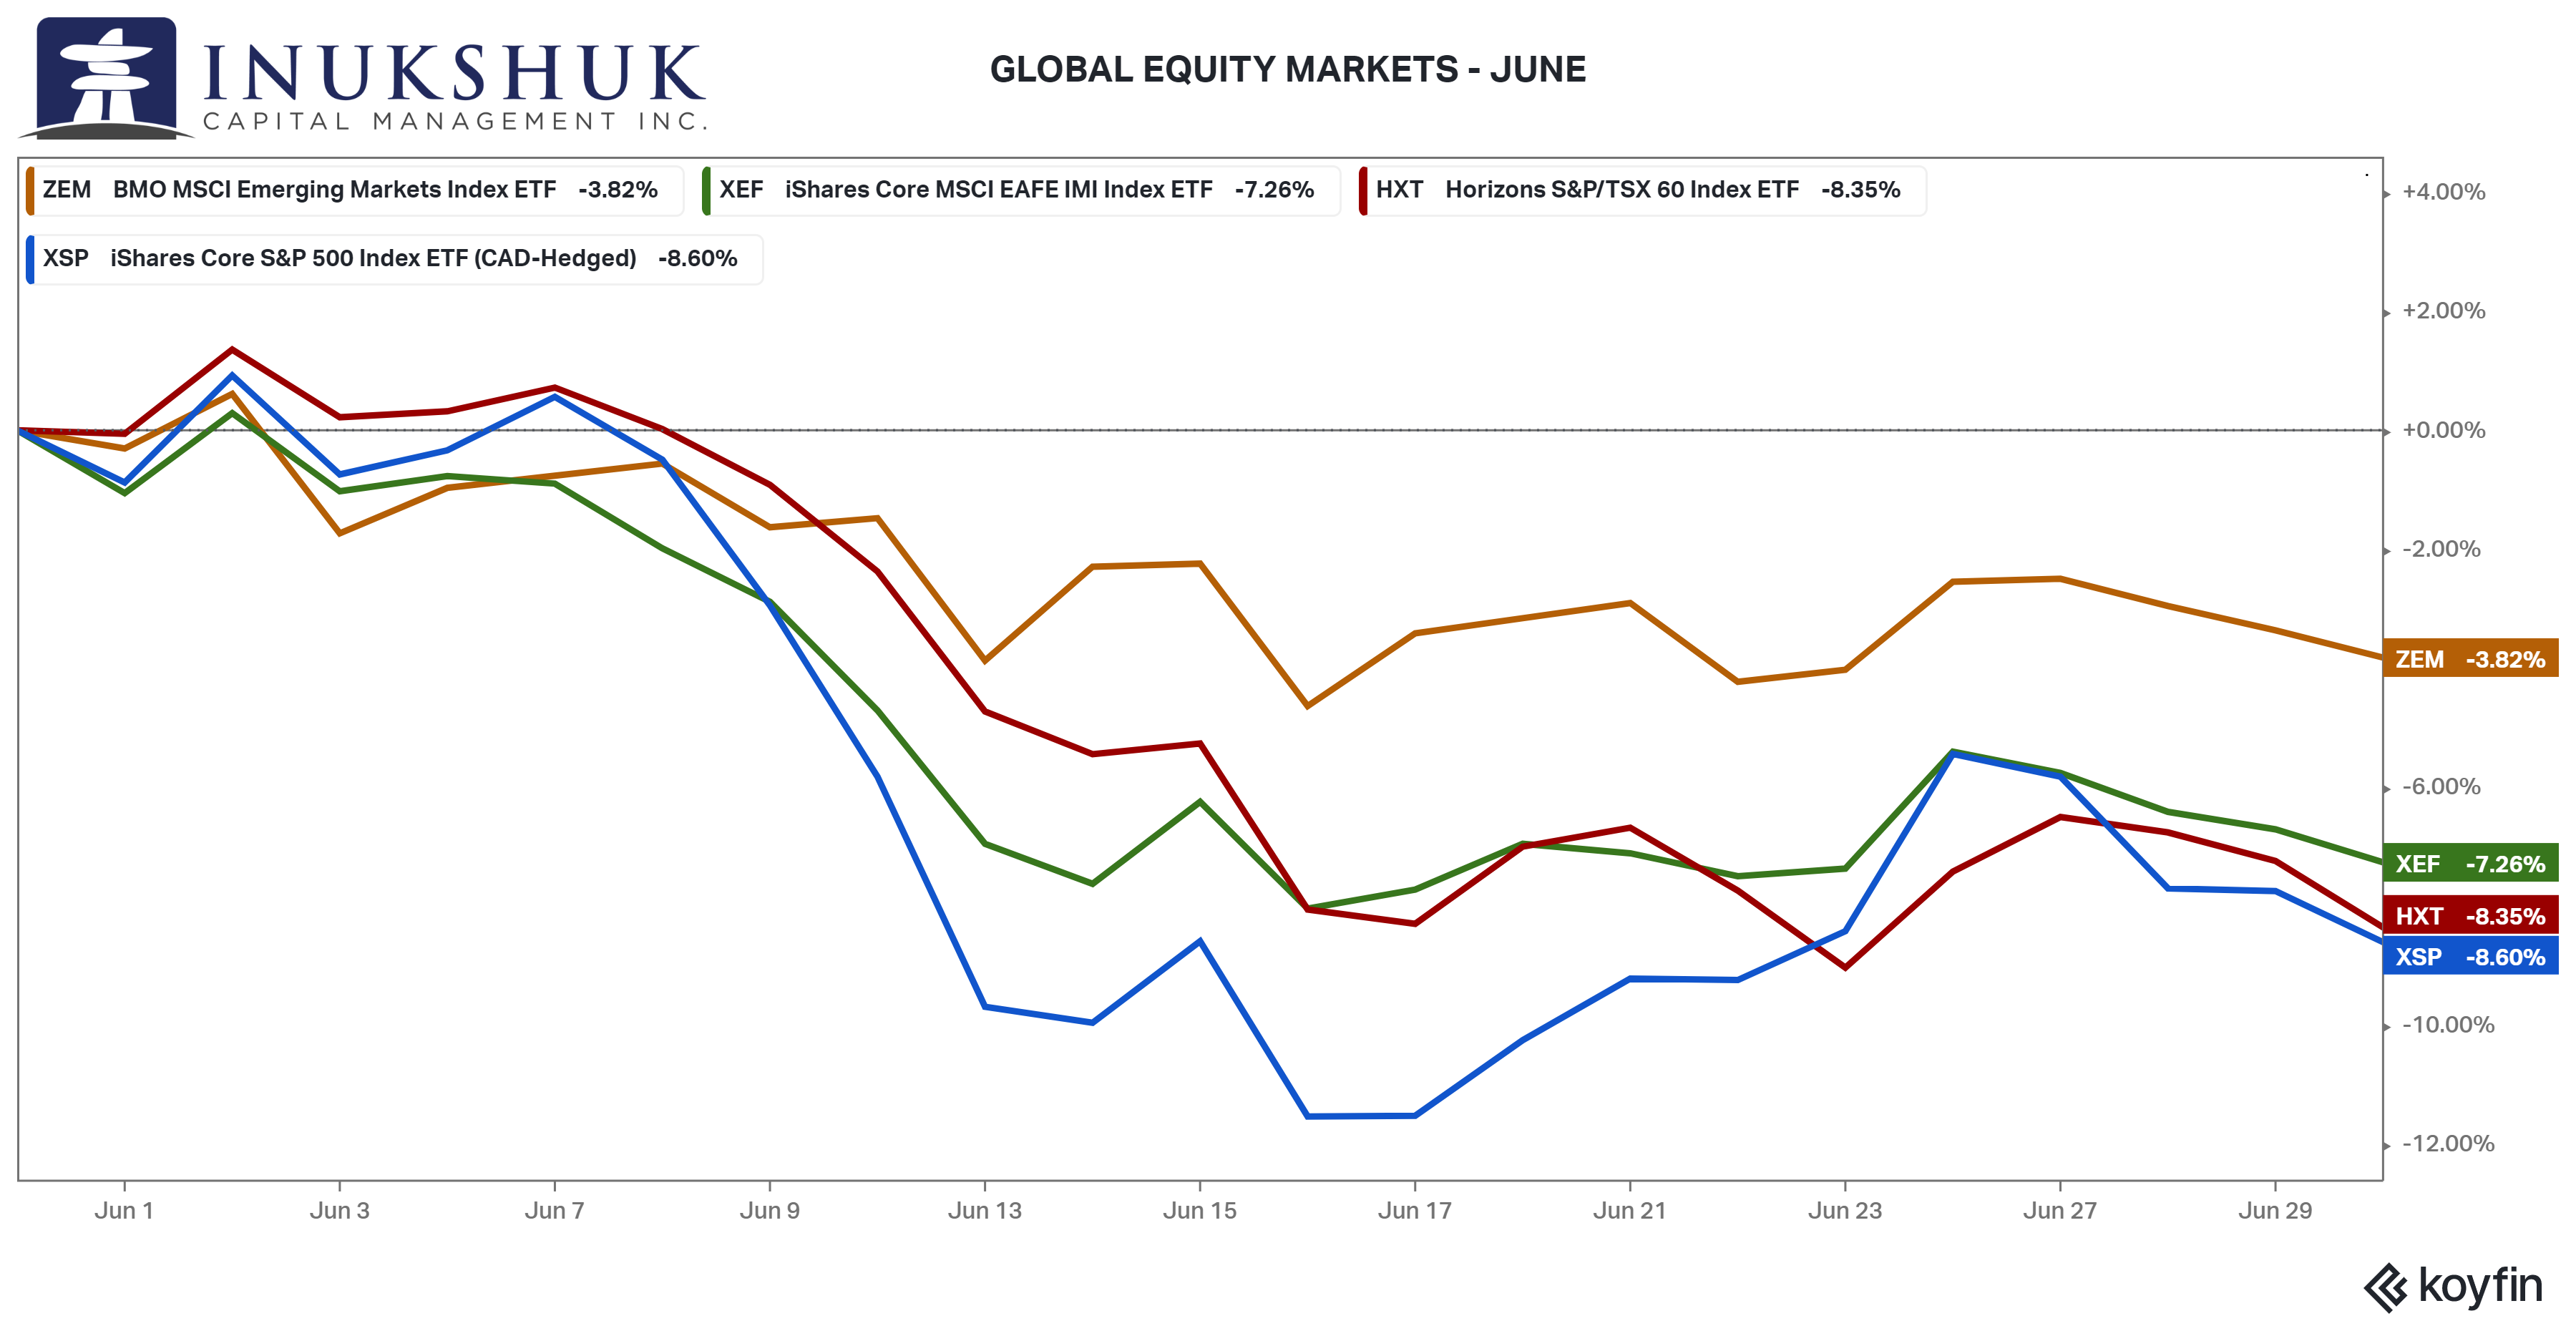
So much for the breather in May – June was the worst month so far this year.
The S&P/TSX60 finally cracked after hanging in admirably for the first five months of the year and ended down 8.3% on the month.
Our active program raised more cash in May, so that allocation is now flat across the four equity indexes: the S&P/TSX60, S&P 500, EAFE (Europe, Australasia and Far East) and Emerging Markets, the latter two for more than a year.
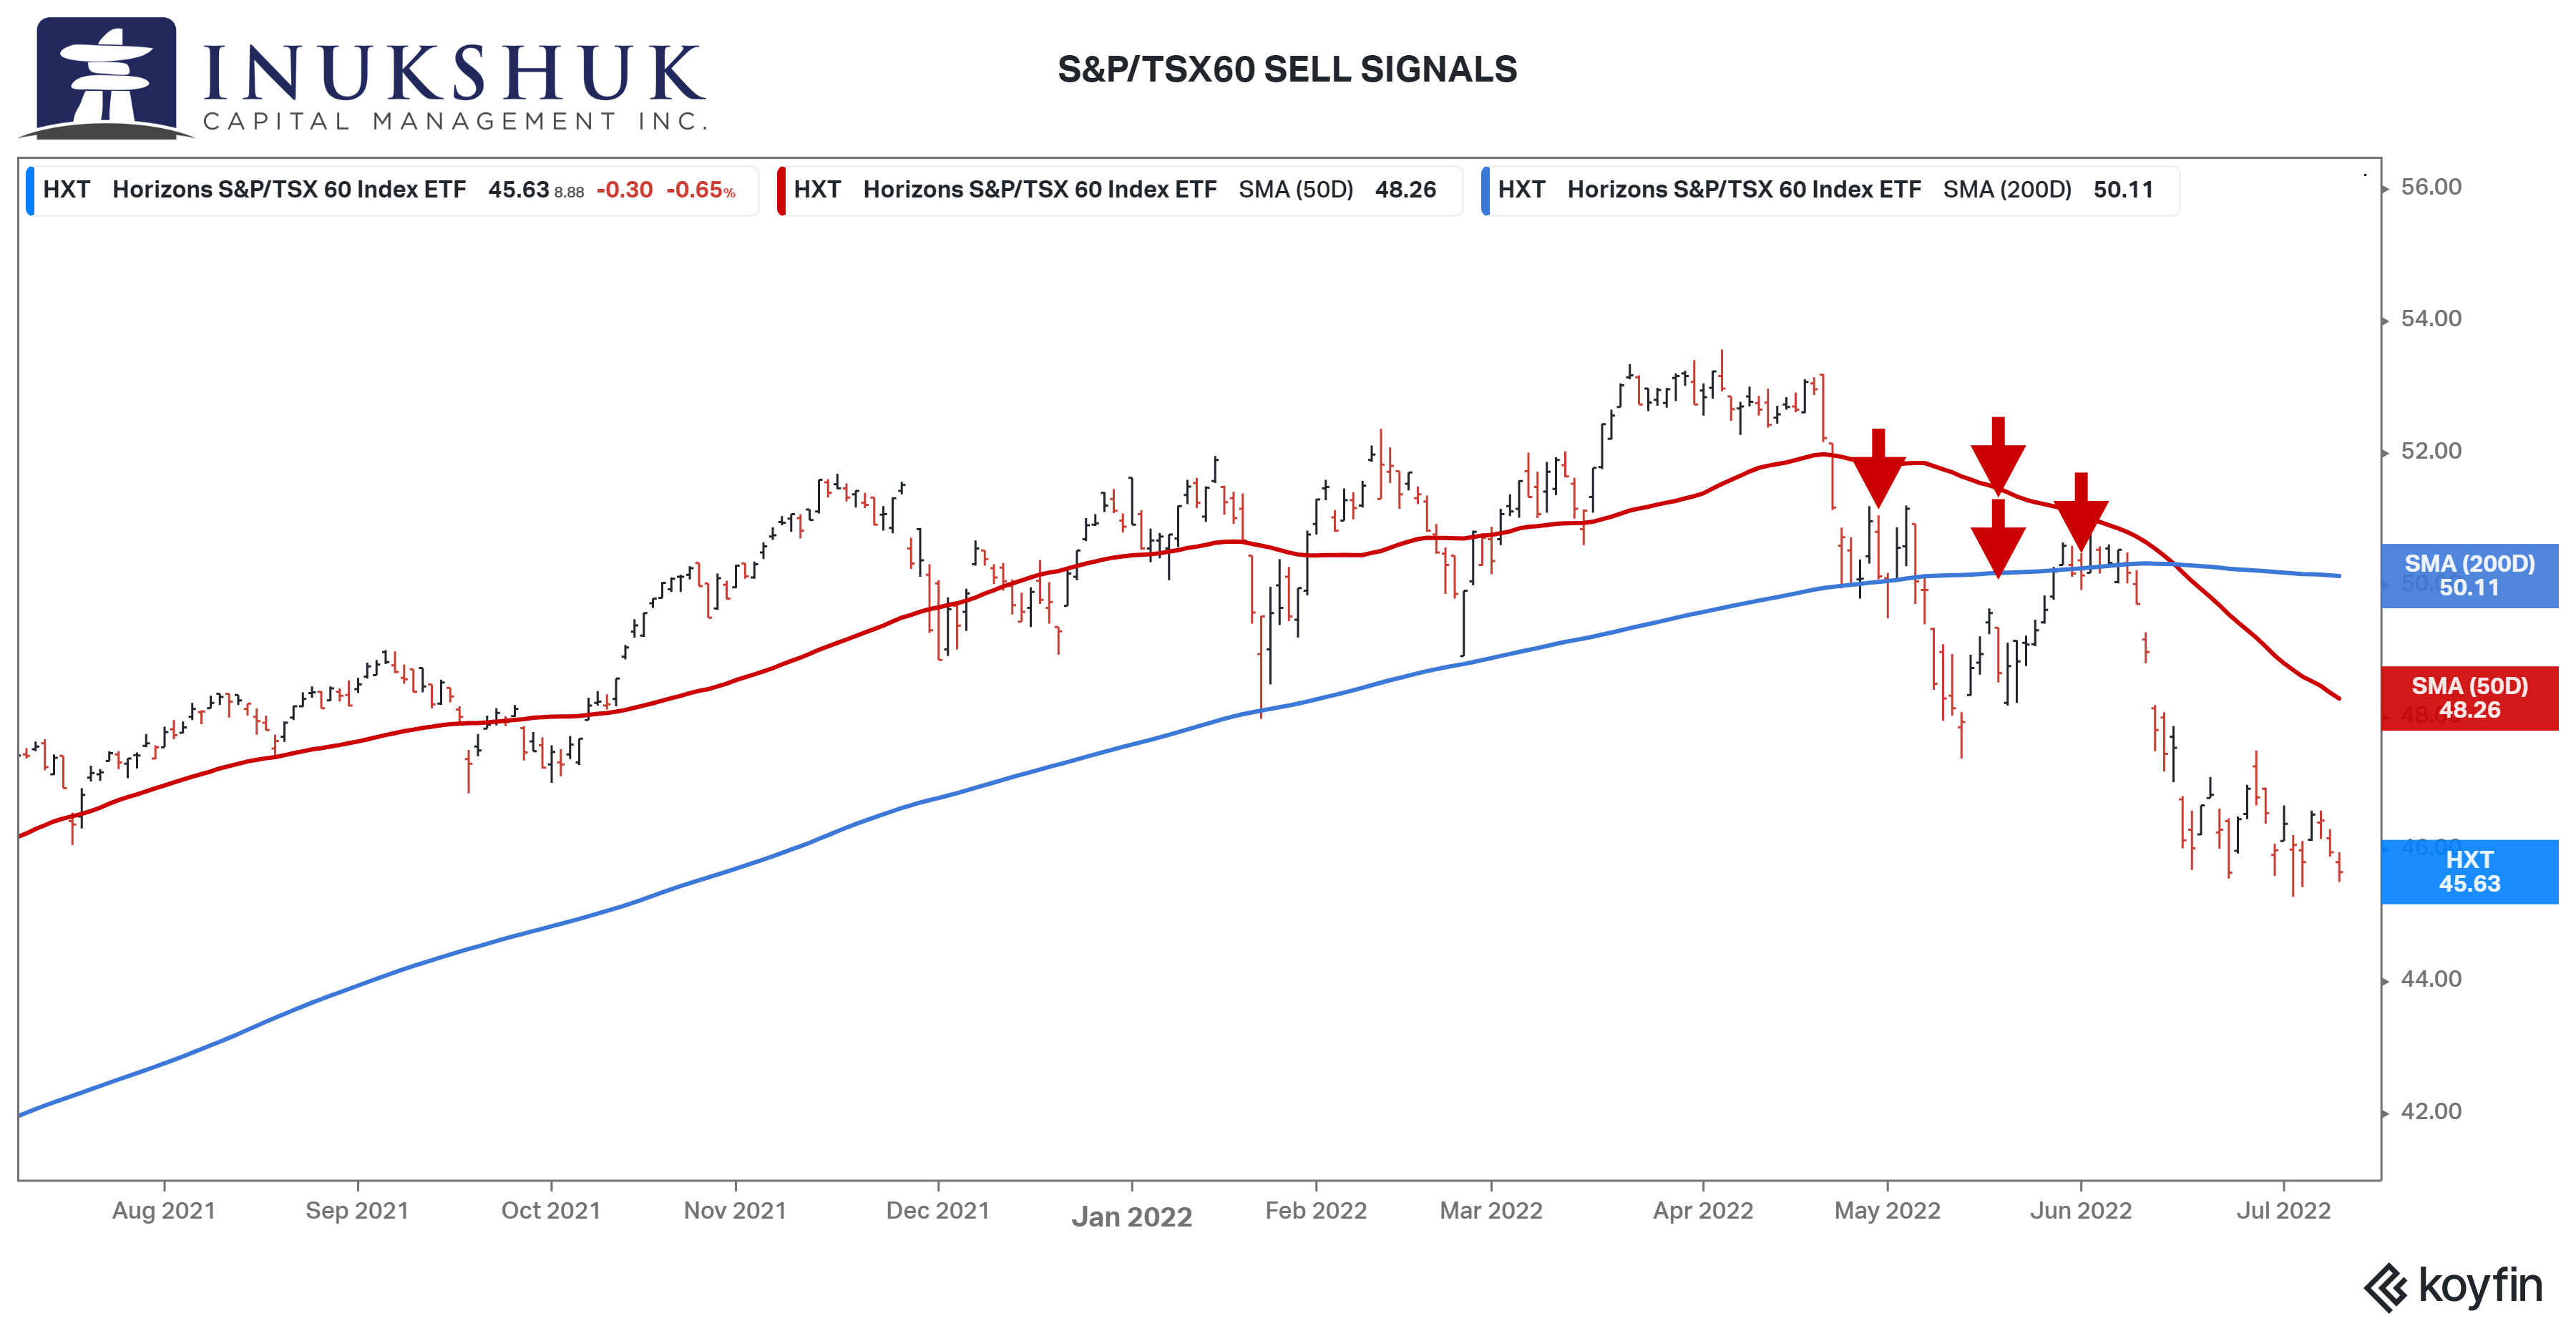
The way our systems are designed exposes us to the first down moves in the indexes, but we exit early enough to avoid as much of the subsequent drawdown as possible. On the opposite side of the coin, we may miss the earlier part of a rebound because our systems are built to detect positive trends that are expected to persist. In both cases, this is to avoid whipsaws, or signals that fail quickly, as much as practically possible.
Here is how that looked for the S&P/TSX60 as represented by the Horizons ETF, HXT. The red arrows are where we sold.
When constructing portfolios, we apply multiple types of diversification to achieve good risk adjusted returns. The active component of our portfolios is now in ‘wait-and-see’ mode. The systems will need to detect positive price momentum before they re-deploy cash into equities.
If you would like to stay current on our measures of trend and momentum in the markets we follow, please click here
NORTH AMERICAN EQUITY MARKETS – YEAR TO DATE
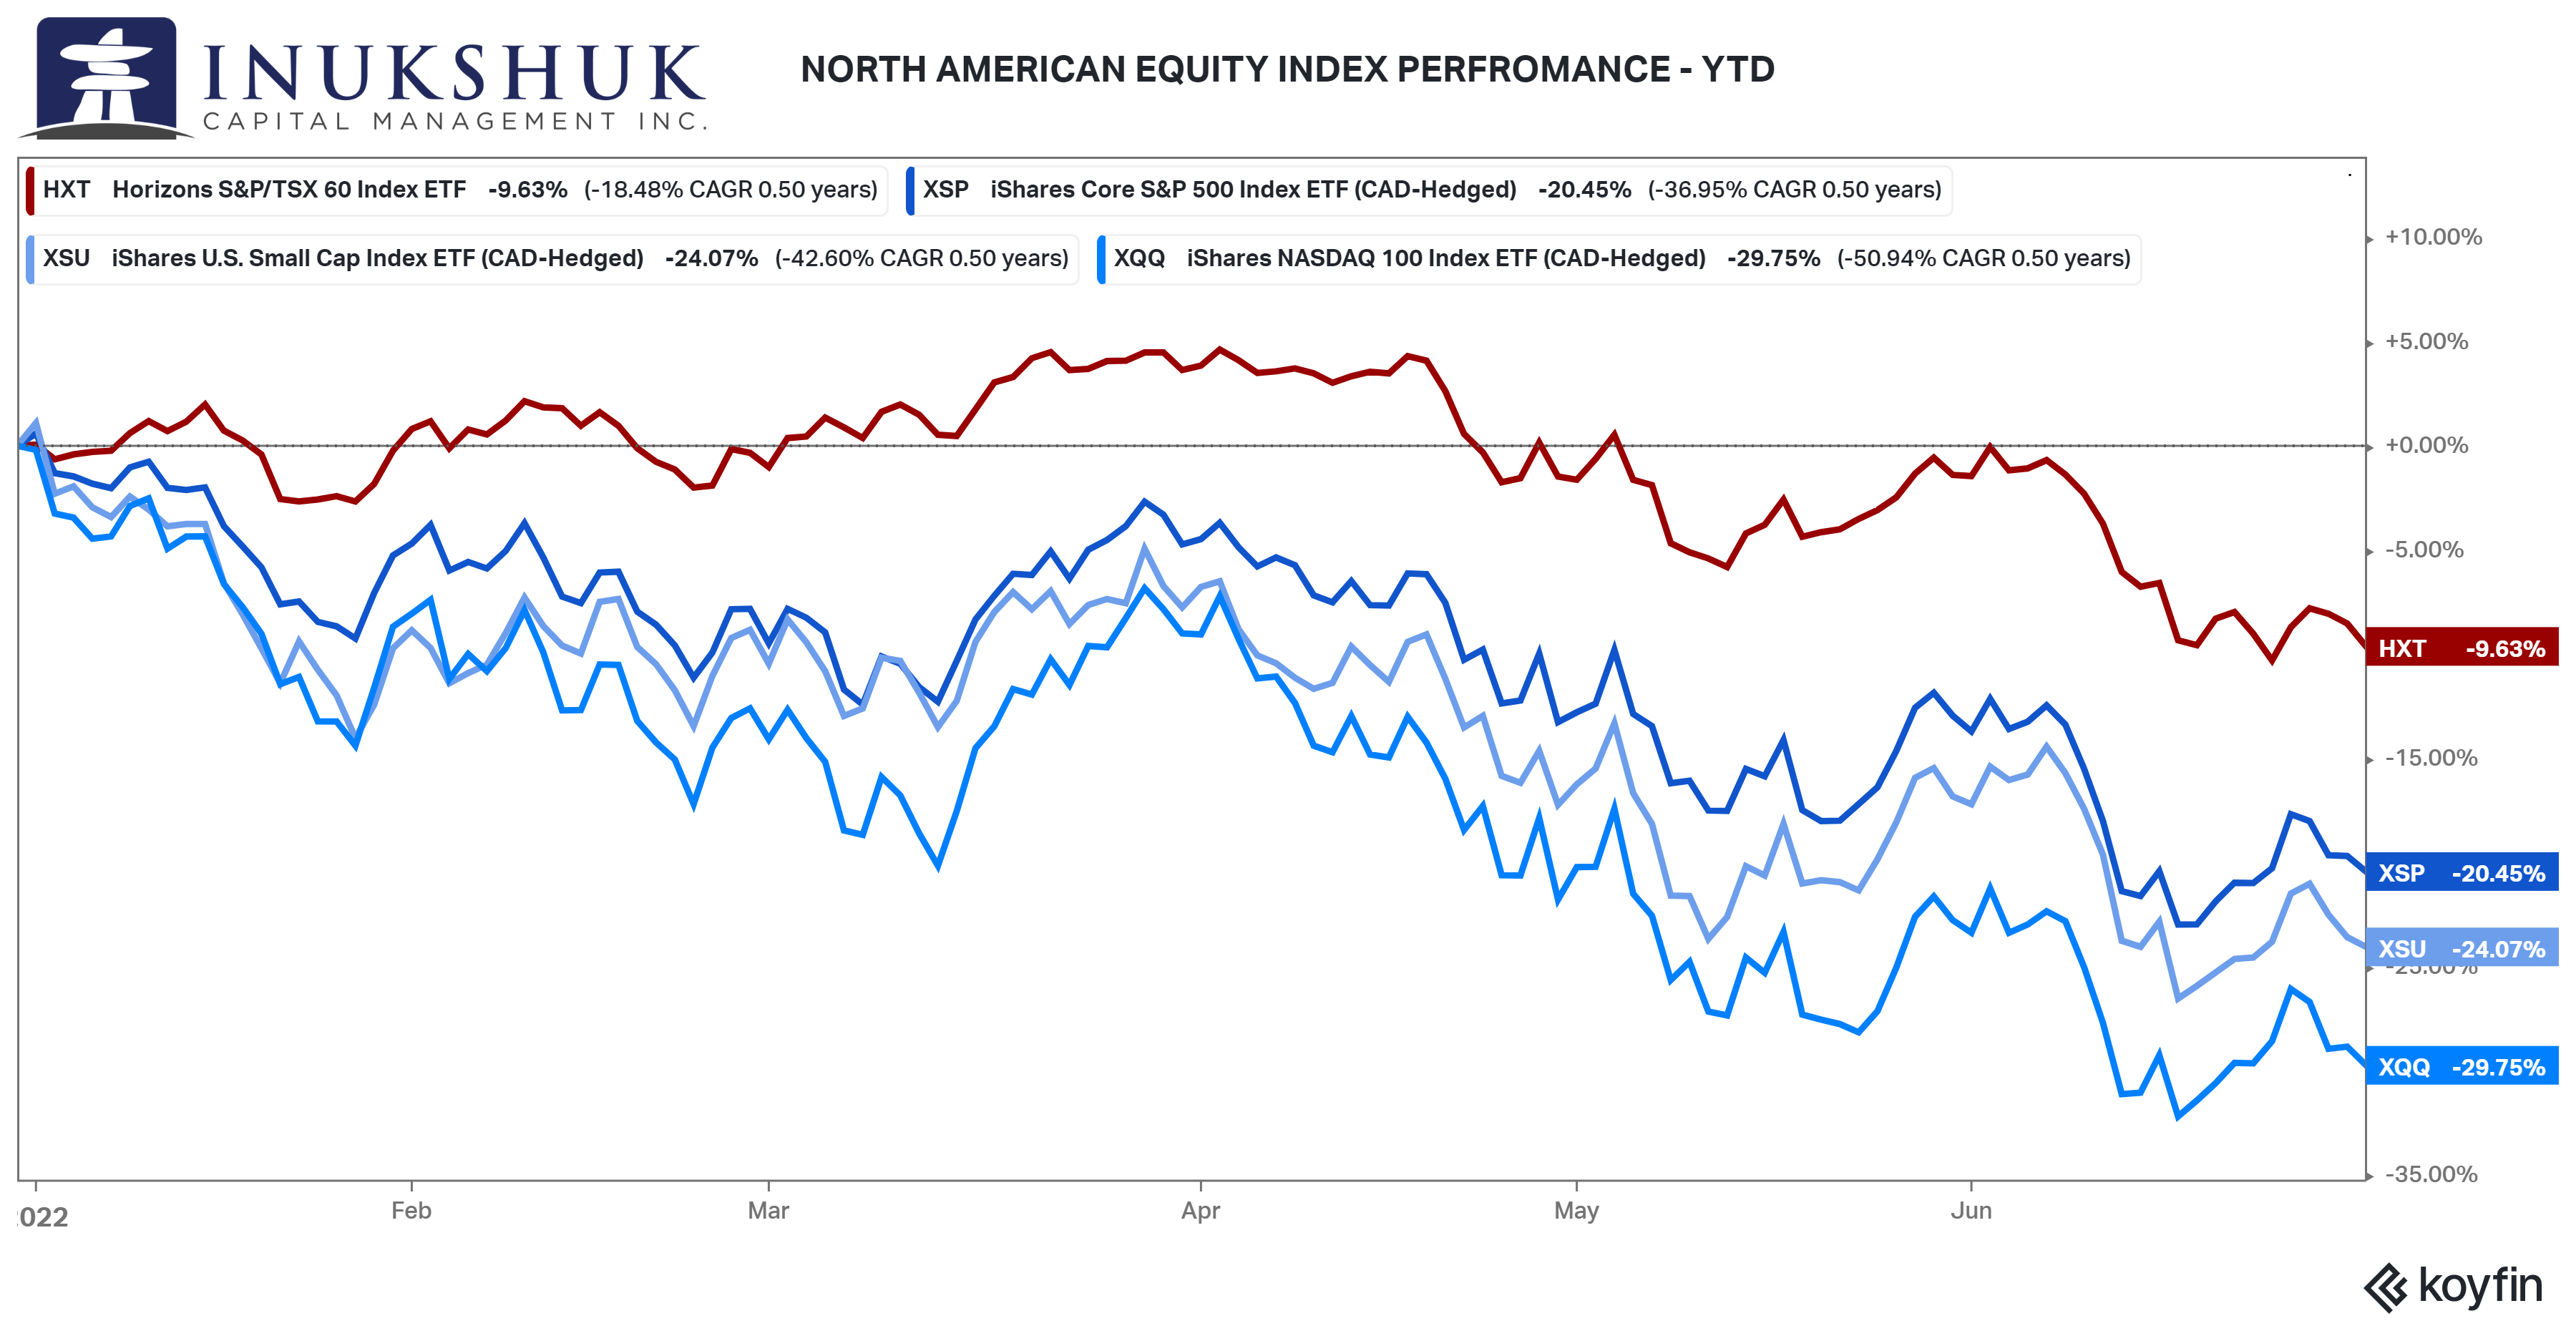
We have used some of the cash that has been raised to invest in the True Exposure Exogenous Risk Pool (TERP). TERP is a liquid alternatives mutual fund that employs Inukshuk-designed systems to invest in the major North American equity indexes as represented by some of the largest ETFs trading in the U.S. The mutual fund structure is necessary because this strategy has a long-short component as a hedge against market shocks. Since its launch in January, the S&P 500 is down over 15% while the fund is down, excluding re-invested distributions, only 0.88%. This allocation further diversifies our client portfolios.
Here’s a look at North American stock index performance year-to-date.
STOCKS AND BONDS – YEAR TO DATE
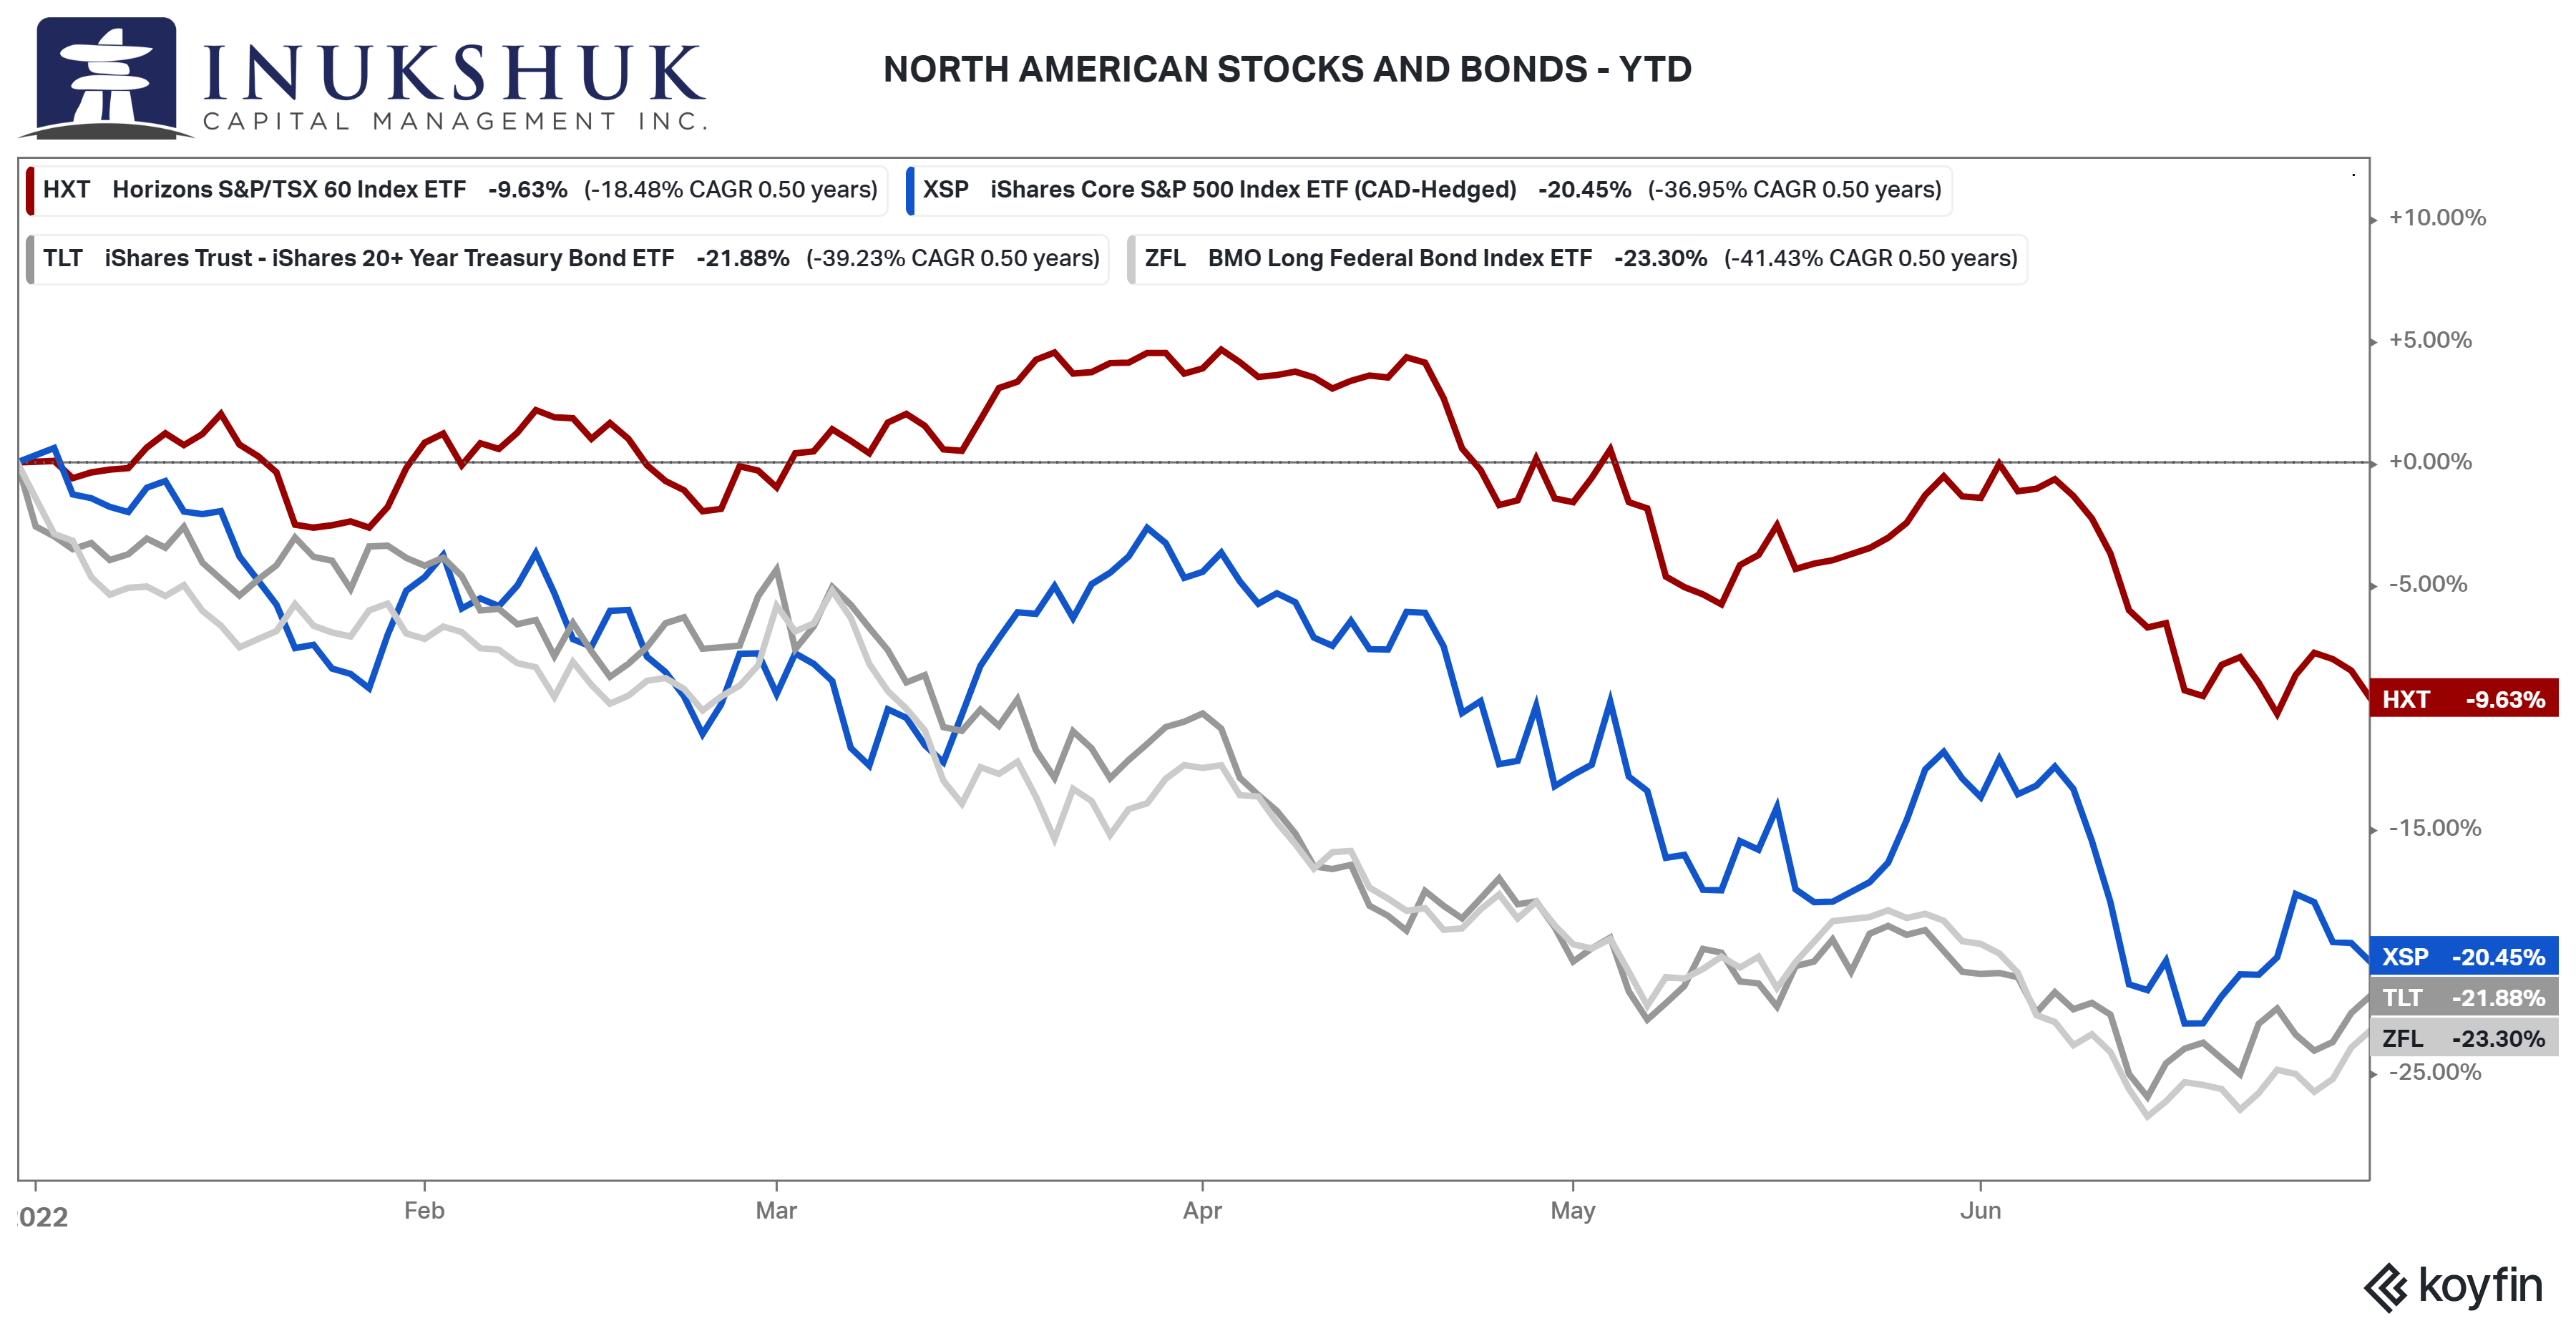
Most of our portfolios have an allocation to fixed income. This is a standard method to balance the overall risk of investing. Fixed Income has been an effective hedge against equity drawdowns for decades, but this has not been the case for many months.
Bonds are having one of the worst starts to any year going back decades. There has been almost no benefit allocating to fixed income considering their equity-like returns year-to-date.
GLOBAL EQUITY MARKET PERFORMANCE – YEAR TO DATE
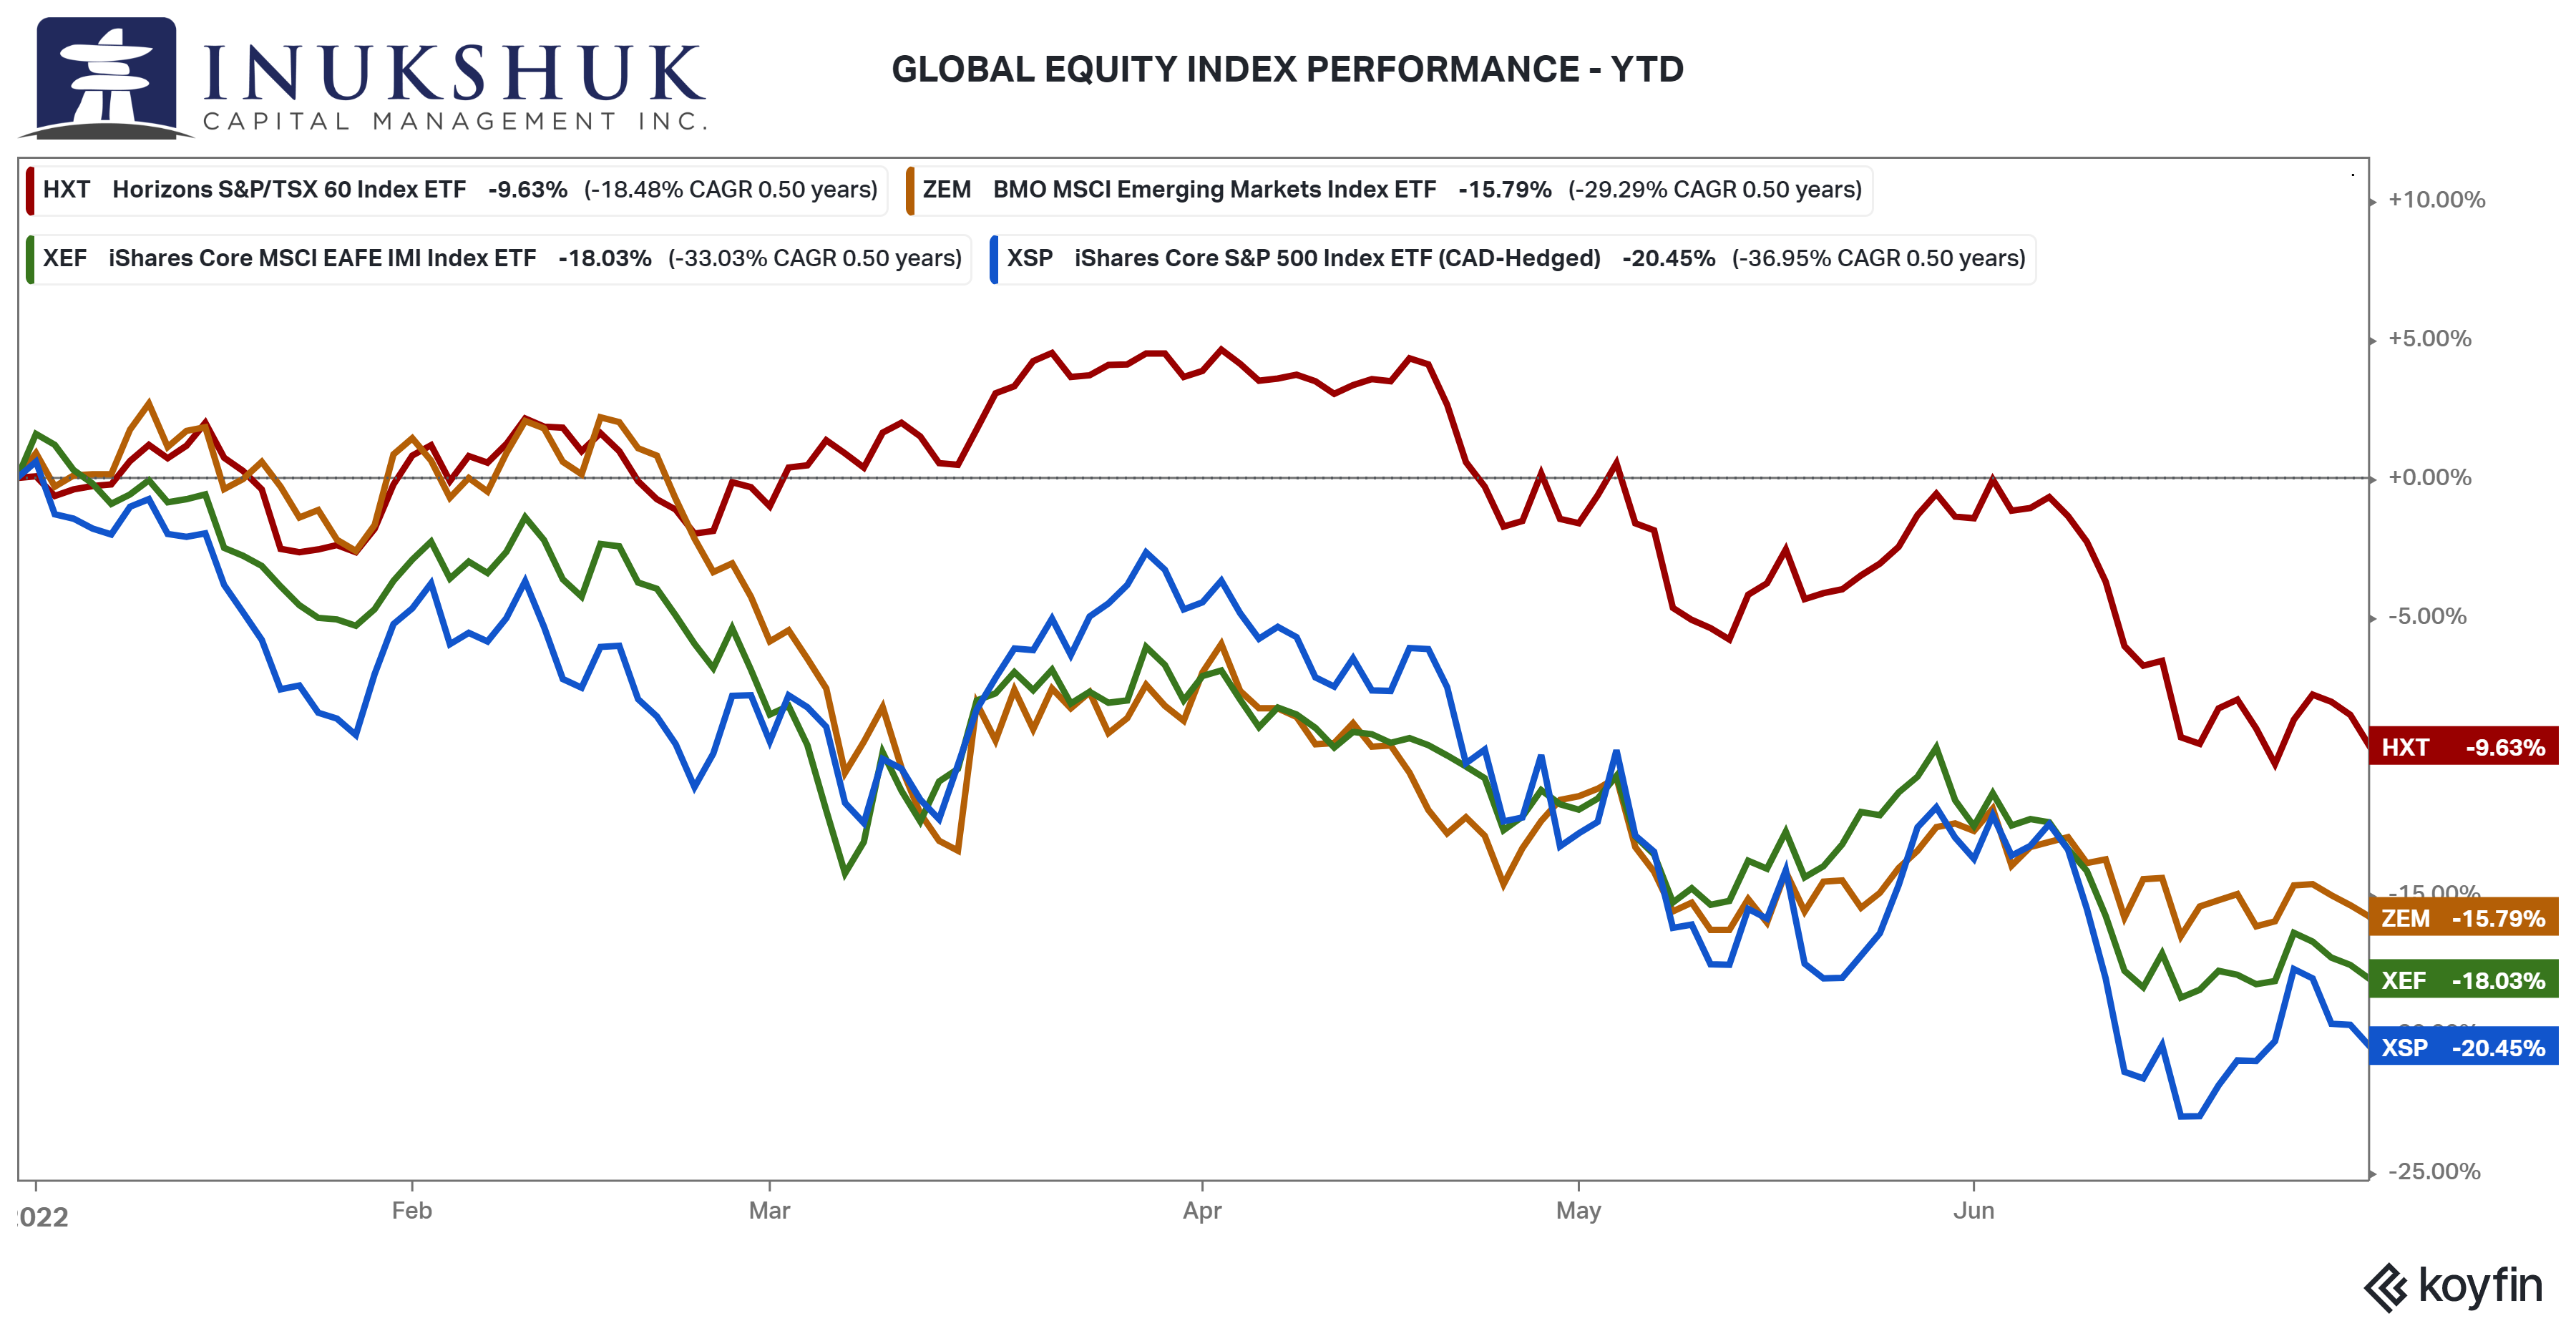
Geographical diversification hasn’t helped either. Here is the performance so far this year of the four global indexes we actively trade.
Investing outside of North America has been hazardous to returns for more than a year.
Despite all of this, we stick to the plan: follow our models and asset allocation and wait for opportunities to present themselves.
It is not always comfortable, but we do know that deviating from a plan is typically not a good idea.
That’s fine, a reader may think, but the question is: what’s next?
HISTORICAL RETURNS
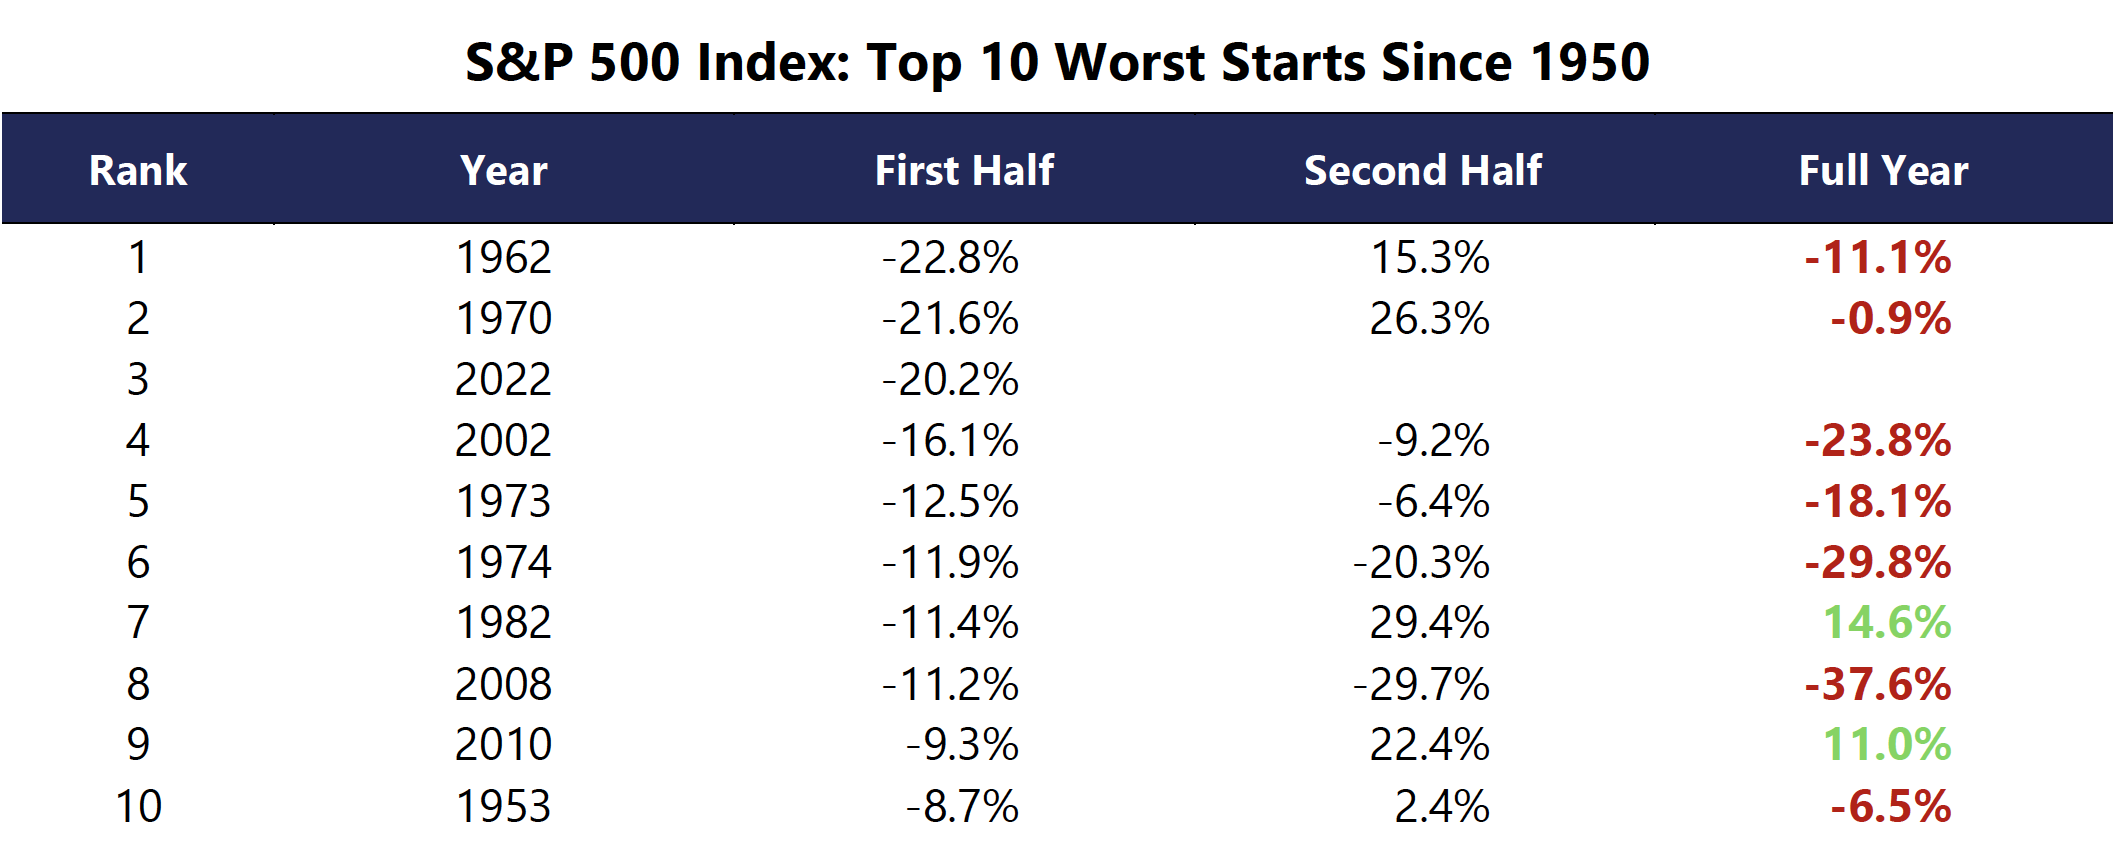
We are not in the prediction business. However, looking at historical returns can provide insight into how a year like this compares to years in the past. The short answer: it’s right up there with the worst.
The bronze medal standing is nothing to brag about. Being in the top three of the worst, in anything, going back 70 years is difficult. Of the other nine instances where we know the result, only two resulted in a net gain on the year – although it should be noted that 1970 almost made it back to flat.
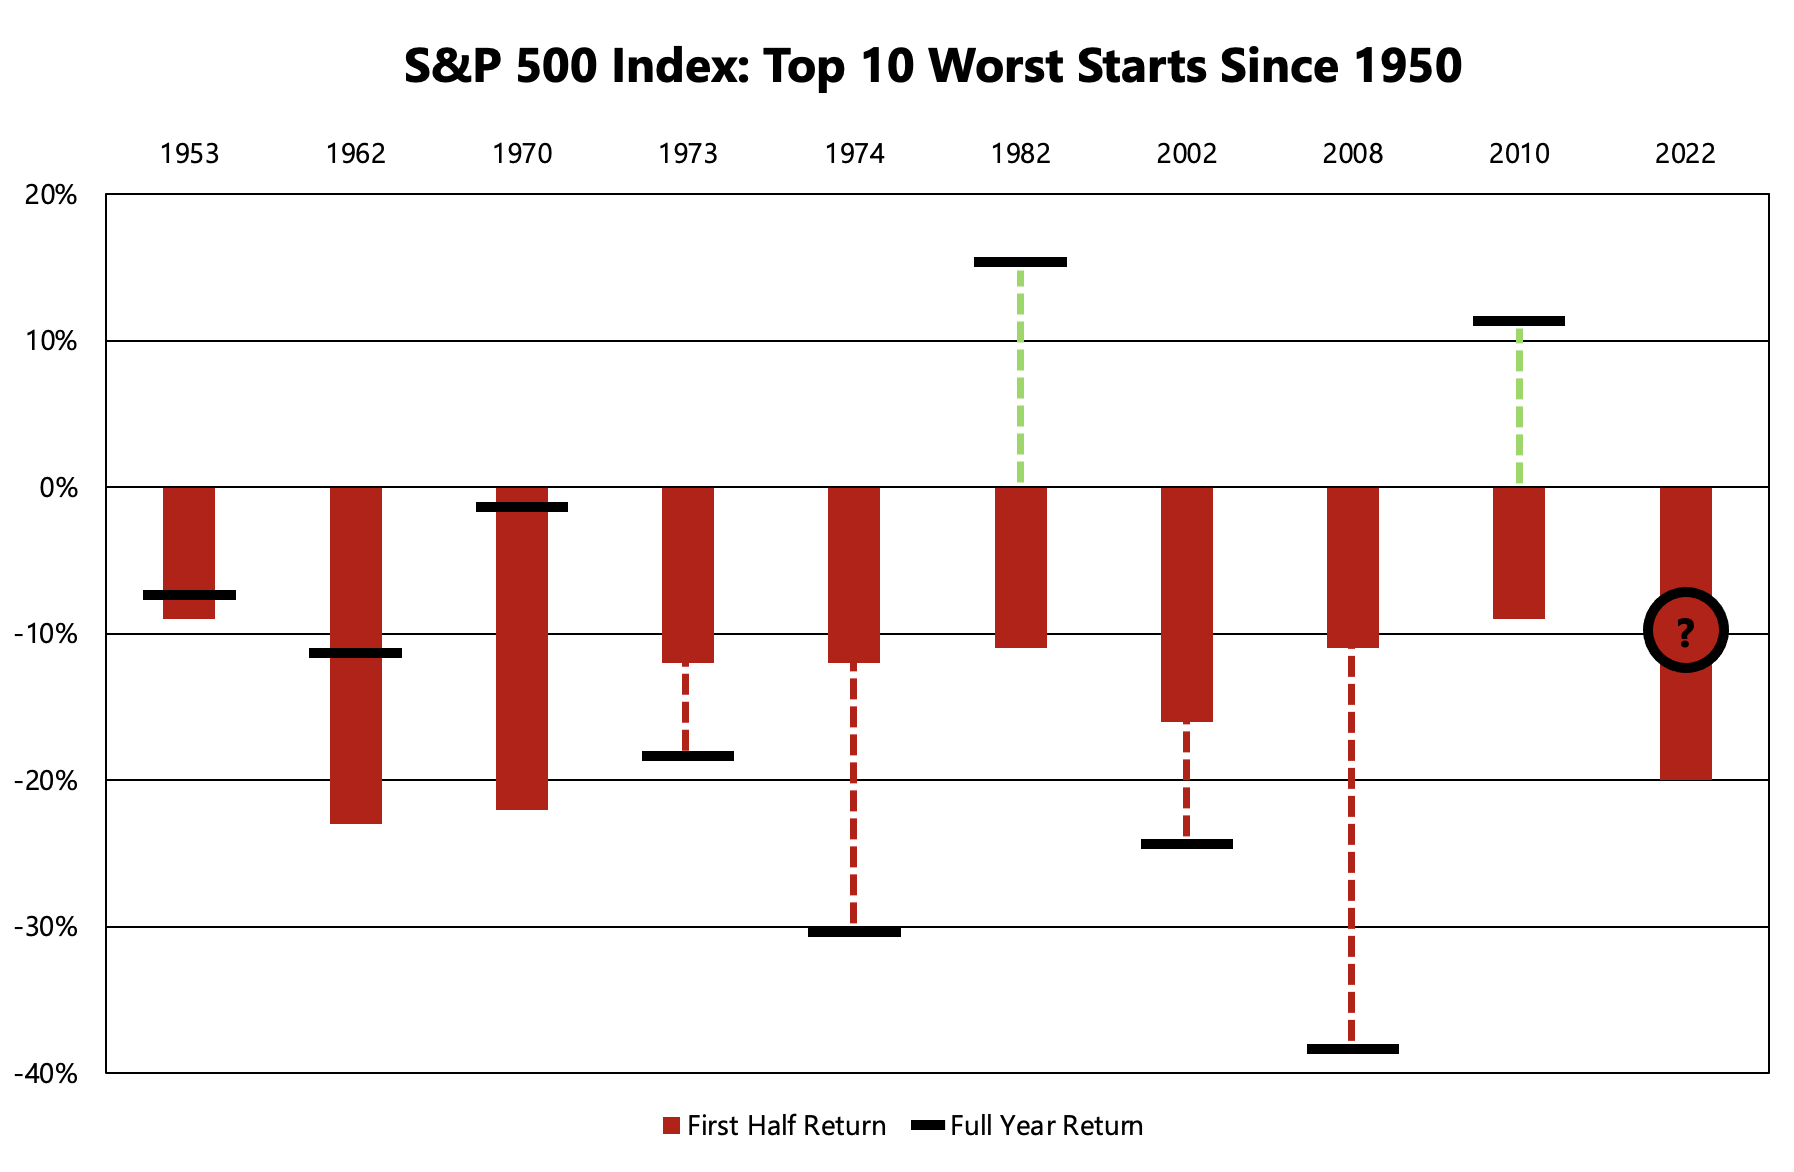
Let’s look at how this top 10 was distributed over time. In this chart, the first half of the year’s performance is represented by solid red bars and the full-year by the dashed line. The ‘clueless’ bar is now.
Admittedly, that is not a lot of data, but five of the years saw second-half rallies. The question is: where does ![]() end up ?
end up ?
NASDAQ 100 ANALOGUE
Another way to look at historical comparisons is by looking at the path of the same market in the past. In this example, we chose the Nasdaq 100 because it is the worst broad index performer this year and some of us still remember the dot com crash.
As noted in the May letter, the 2000-2001 drawdown in the Nasdaq was historic. In this thought experiment, let’s look at what happened after the March 24, 2000 peak. It’s fairly simple. Take the Nasdaq’s all-time high in 2000, line it up with the most recent all-time high in November 2021 and compare.
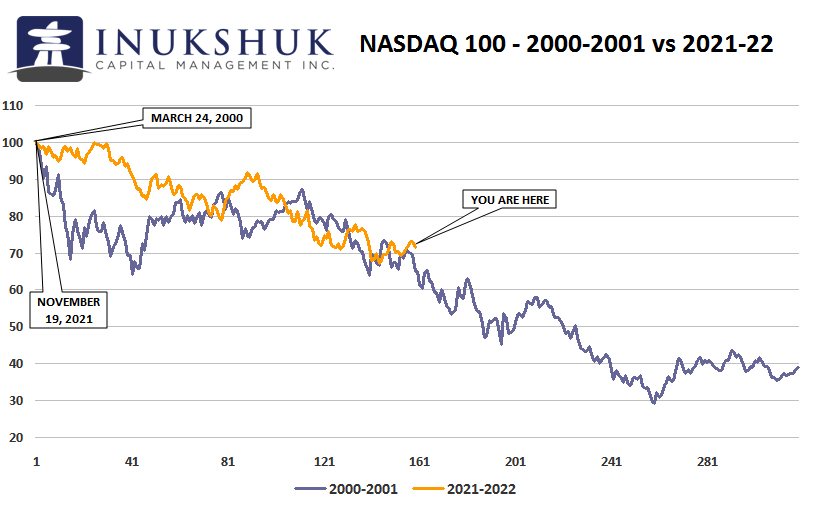
We don’t use analogues as drivers of our systems. We use historical data, but not in this manner. This is simply a comparison of what happened then, to what is happening now. There are so many interactions of politics, policy, economics, prior behaviour and experience that contribute to the current price of any asset. That’s the reason we rely on price. Trends exist but it’s not always clear, even in the aftermath, why they started or how far they will go.
IN SUMMARY
These are historic times. The list of things troubling global markets is long. Many market participants have not experienced this kind of environment in their careers. At Inukshuk, our portfolio managers have experienced all kinds of market disruptions – the Sterling-ERM crisis (1992), Quebec referendum (1995), Irrational Exuberance (1996), Asian financial crisis (1997), Long-Term Capital Management (1998), dot com crash (2000), Global Financial Crisis (2007), Mystery of 2018, Pandemic Panic (2020) and now. 1970 is a wee bit early for us, but it’s nice to have the data.
While this sell off, and those listed above, all caused stress and angst, the stock markets have gone on to reach new highs in subsequent years and we feel comfortable saying that the stock market will recover, we just do not know when. Our systems will give us a clue, so stay tuned.
As the baseball sage Yogi Berra once said: You’ve got to be very careful if you don’t know where you are going, because you might not get there.
At Inukshuk, we always have a destination in mind with a plan to get there.
HEALTH IS WEALTH
Metabolism
Metabolism is the process by which your body converts what you eat and drink into energy. During this complex process, calories in food and beverages are combined with oxygen to release the energy your body needs to function.
What you eat plays an important role in your metabolic health, but it is not the only variable. There are three primary variables that affect our metabolism:
1. Food
Your metabolism increases whenever you eat, digest and store food.
Our metabolism will help us maintain a healthy body and weight if we make smart choices about the food we eat and how much of it we consume. We are less likely to over-eat if we stay away from fried foods and refined sugars. These energy sources are the most likely to end up stored as fat. Foods to consider are those that keep you satiated longer and help you feel ‘full’ for longer, such as protein-rich foods, whole grains, fruits and vegetables.
Protein-rich foods require your body to use more energy to digest. This is known as the thermic effect of food (TEF). Protein also helps you maintain and grow muscle. At any given weight, the more muscle on your body, and the less fat, the higher your metabolic rate. That’s because muscle uses a lot more energy than fat, even while we rest. Caffeine increases your resting metabolic rate, which means it too increases the number of calories you burn at rest.
2. Exercise
Exercise becomes increasingly important as you get older. As you age, you lose muscle mass, which slows down your metabolism. Exercise and movement can stop the slide. Aerobic exercise like running, walking or anything which elevates your heart rate for a sustained period will help you burn more calories, but it won’t help you add or maintain muscle. Include resistance training to increase your natural calorie burner – muscle.
3. Stress
Stress can negatively impact your metabolism. When we experience stress, our body produces cortisol sending our nervous system into fight or flight mode, and slowing our metabolism. This associated decrease in metabolism increases insulin levels, which slows down the breakdown of fat.
This is by no means an exhaustive description of the metabolism or the things that affect it, but there are ways we can keep our metabolism in check and our body and mind healthy. Our body and our mind are connected. What we put into them affects their health and longevity.
‘To sustain it, you must maintain it’
Victoria Bannister
ICM Health Ambassador
Have a question? Contact us here.
Challenging the status quo of the Canadian investment industry.


