
At Inukshuk Capital Management, our focus is on building lasting relationships rooted in trust and collaboration. By focusing on active risk management and long-term value creation, we help families and institutions achieve financial sustainability.
Stay up-to-date on the latest developments by following us on LinkedIn here.

In this issue:
- Global Equity Market Performance
- April Showers
- Fear
- Drawdowns
- Wrapping Up
Global Equity Market Performance
April Fool’s lasted longer than just one day. By the end of the sixth trading session, April 8, the S&P 500 was down 11% on the month.
The next day, just after the open, President Trump posted on his social media site, Truth Social: THIS IS A GREAT TIME TO BUY!!! The S&P 500 rallied almost 10% over the next 6 hours. That’s a solid annual return. It rallied into the end of the month and closed with only a 1% loss.
The S&P/TSX 60 had fallen 9.3% at one point and ended the month close to flat. It was the best performer. MSCI EAFE was second best closing with a loss of 0.7%. MSCI Emerging Markets put in the worst performance, losing 3.8%.
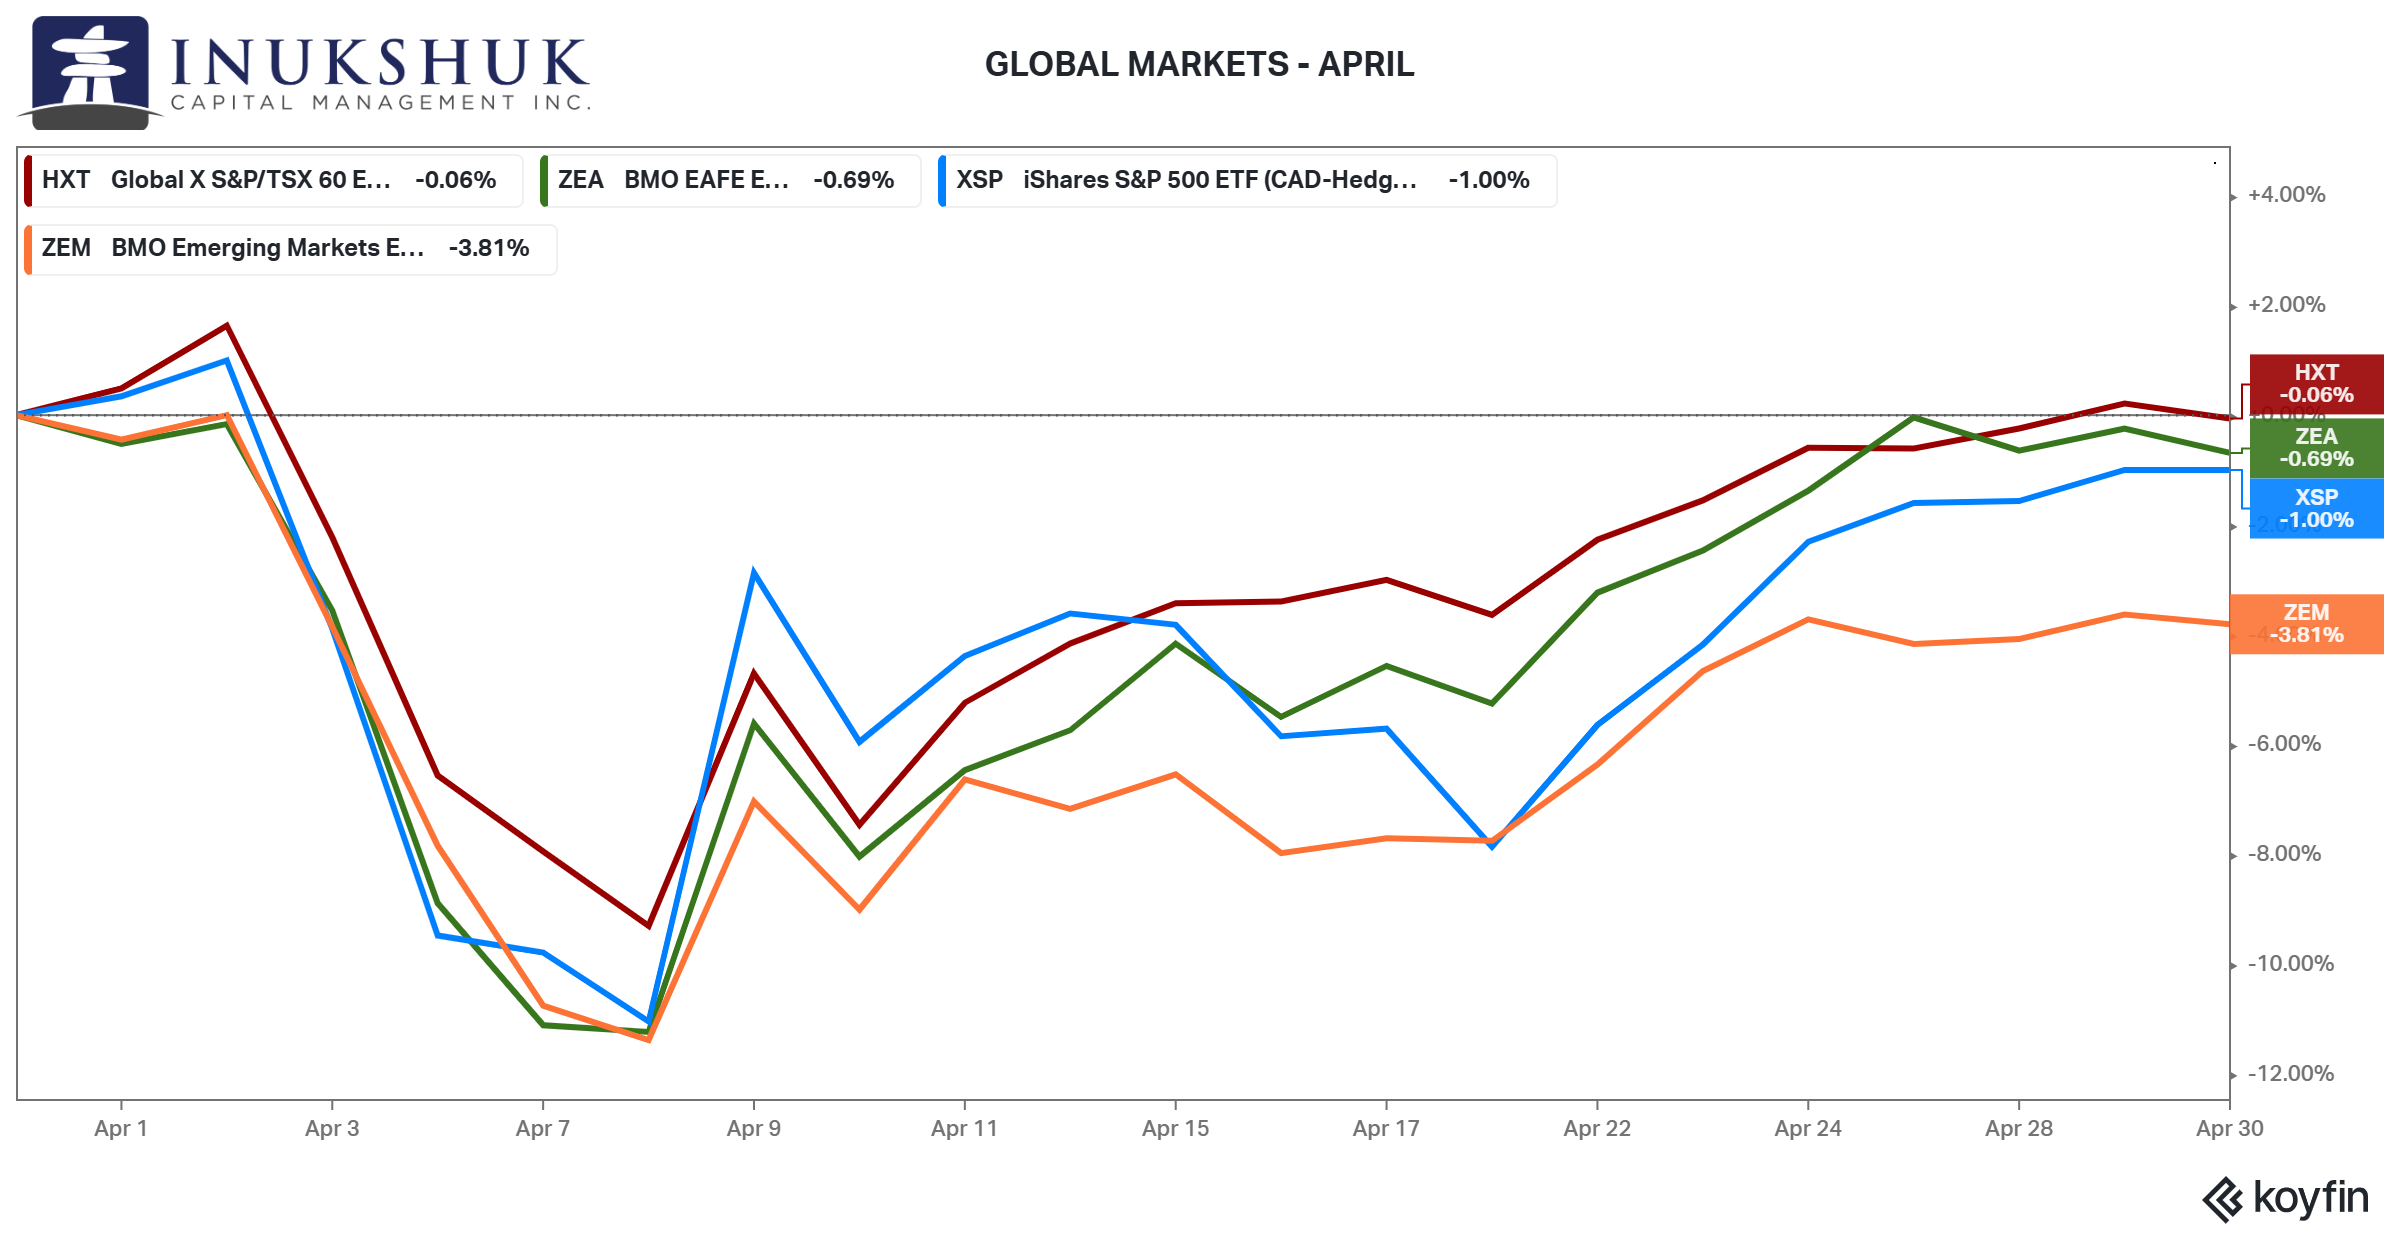
This is the fourth month in a row the S&P/TSX 60 has outperformed the S&P 500.
So far, the low in the S&P 500 is in.
On March 3, 2009, then President Obama made a similar but less enthusiastic statement about buying stocks: What you’re now seeing is profit and earnings ratios are starting to get to the point where buying stocks is a potentially good deal if you’ve got a long-term perspective on it.
A few days later, March 9, the S&P made its low. From the peak in October 2007, it had fallen 57% during the Global Financial Crisis (GFC). And then began a historic bull run, nearly quadrupling over the next decade.
Who knows if the current president will be as prescient as that one was.
Our systems switched to caution-mode the second week of April. As of this writing, the second week of May, those signals still hold.
If you would like to stay current on our measures of trend and momentum in the markets we follow, please click here
The 2007 to 2009 drawdown was one of the worst since the Dow Jones Industrial Average was created in 1896. But it isn’t the worst. This year’s peak-to-trough fall of 16% isn’t close to that, but nonetheless it ain’t no fun. Considering the wild price action in April, this letter will cover what market volatility is.
April Showers
Stock market returns in April don’t really stand out. If you ignored the day-to-day price action and looked at the change on the month, almost nothing happened.
But between those two dates things did get a bit sporty.
According to Econovis, a financial and economic data analysis site, from April 2 to April 8 the S&P 500 lost a total value of $6.1 trillion.
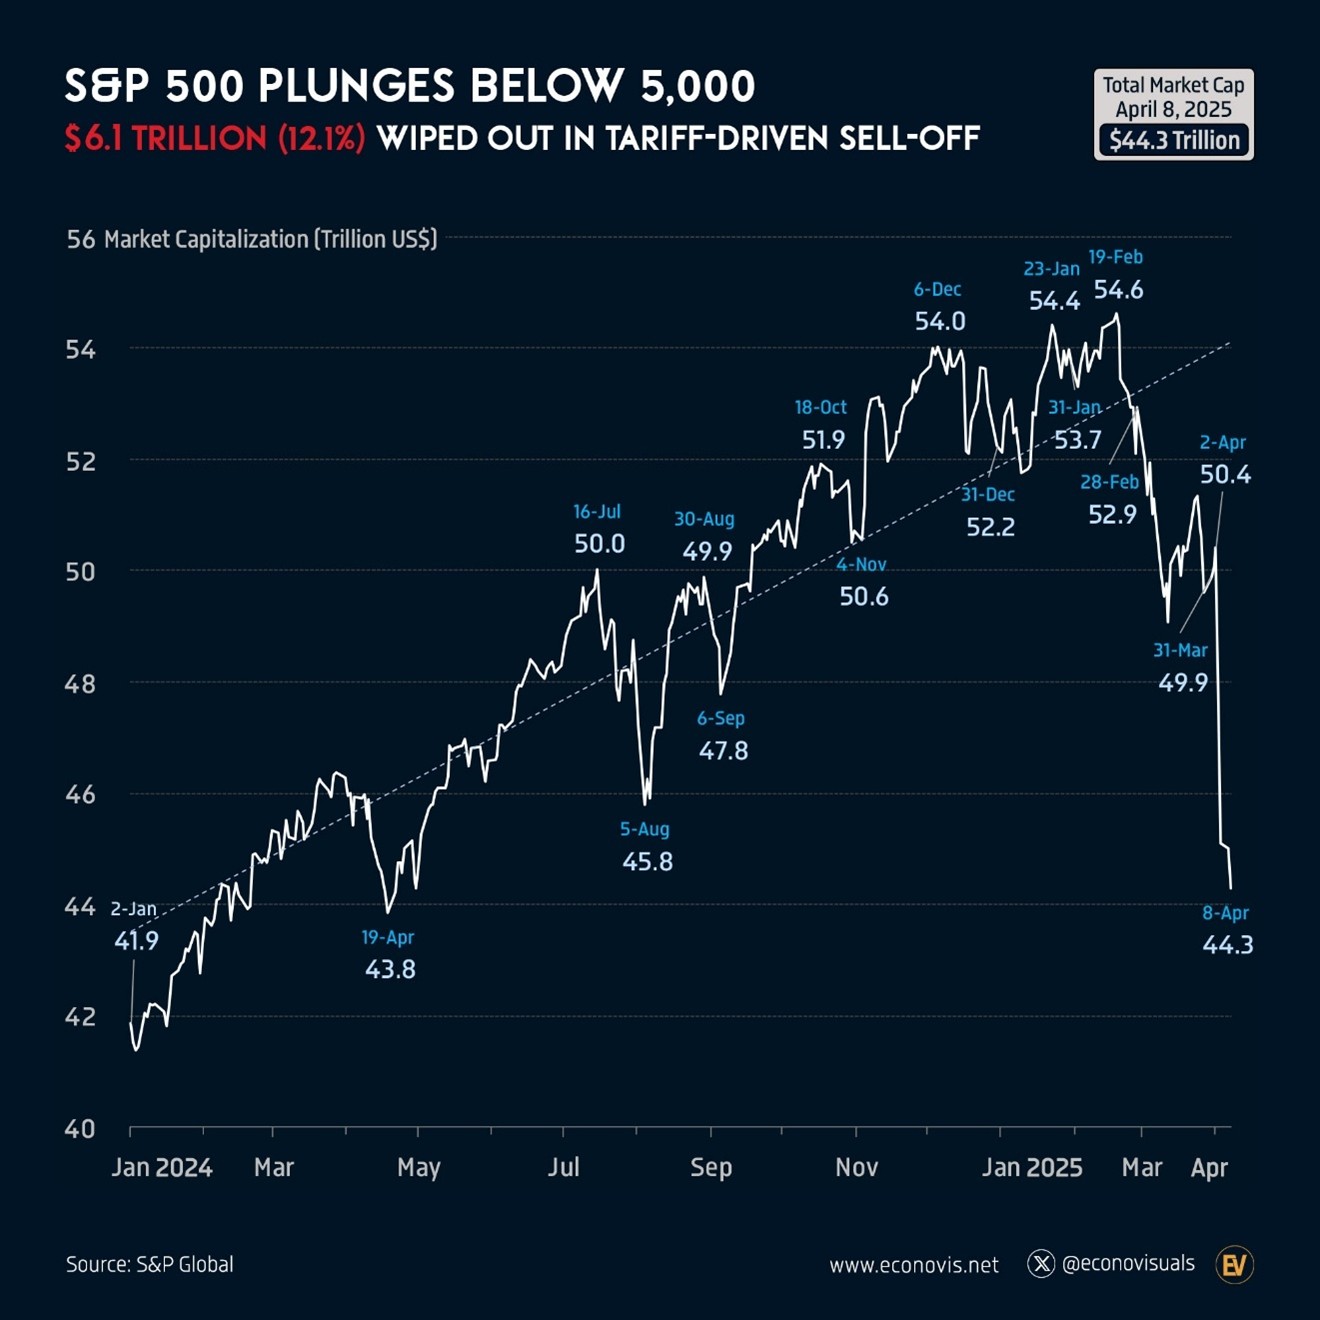
That’s a lot of trillions. A year of wealth earned was erased in a few days.
Ryan Detrick, a market strategist at Carson Research, posted a chart of the number of times since World War II the S&P 500 fell by significant amounts.
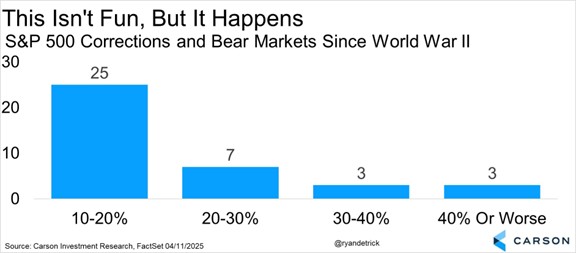
A year like 2025 happens more than you may think. The S&P 500 has fallen more than 10% 38 times in the past 80 years.
Charlie Bilello, Chief Market Strategist at Creative Planning, published a chart that shows the kind of drawdowns you should expect in the S&P 500 intra-year and its final return.
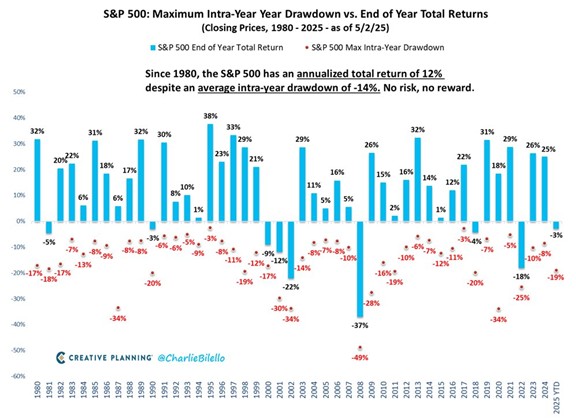
That’s a ‘no pain no gain’ kind of story. To earn good returns, you will have to withstand drawdowns every year. Some are very significant, and the average is 14%.
What’s the lesson from this?
Yes, April was terrible at one point. It happens more than you may think. And you will be in a losing position at some point every year.
Stocks offer the potential to grow your savings. It’s important to know the kind of risk you are taking. Knowing your tolerance for risk is just as important.
The above is good analysis that explains in dollar and percent terms what risk is and how often it happens. Let’s look at another perspective on volatility.
Fear
The CBOE S&P 500 Volatility Index, or VIX, known as the ‘fear gauge’ tracks the market’s current pricing of the volatility of the S&P 500. It is calculated from S&P 500 options prices. Without getting into too much detail, options are priced in dollar terms (the premium) based on expectations of volatility. If you know the price of the underlying security, the price of the option and its time to expiry, you can calculate the implied volatility. That’s what this index represents.
In volatility terms, puts are often more expensive than calls. Puts are like insurance against loss. Calls are insurance against FOMO. When the stock market tanks, the price of insurance against loss, spikes.
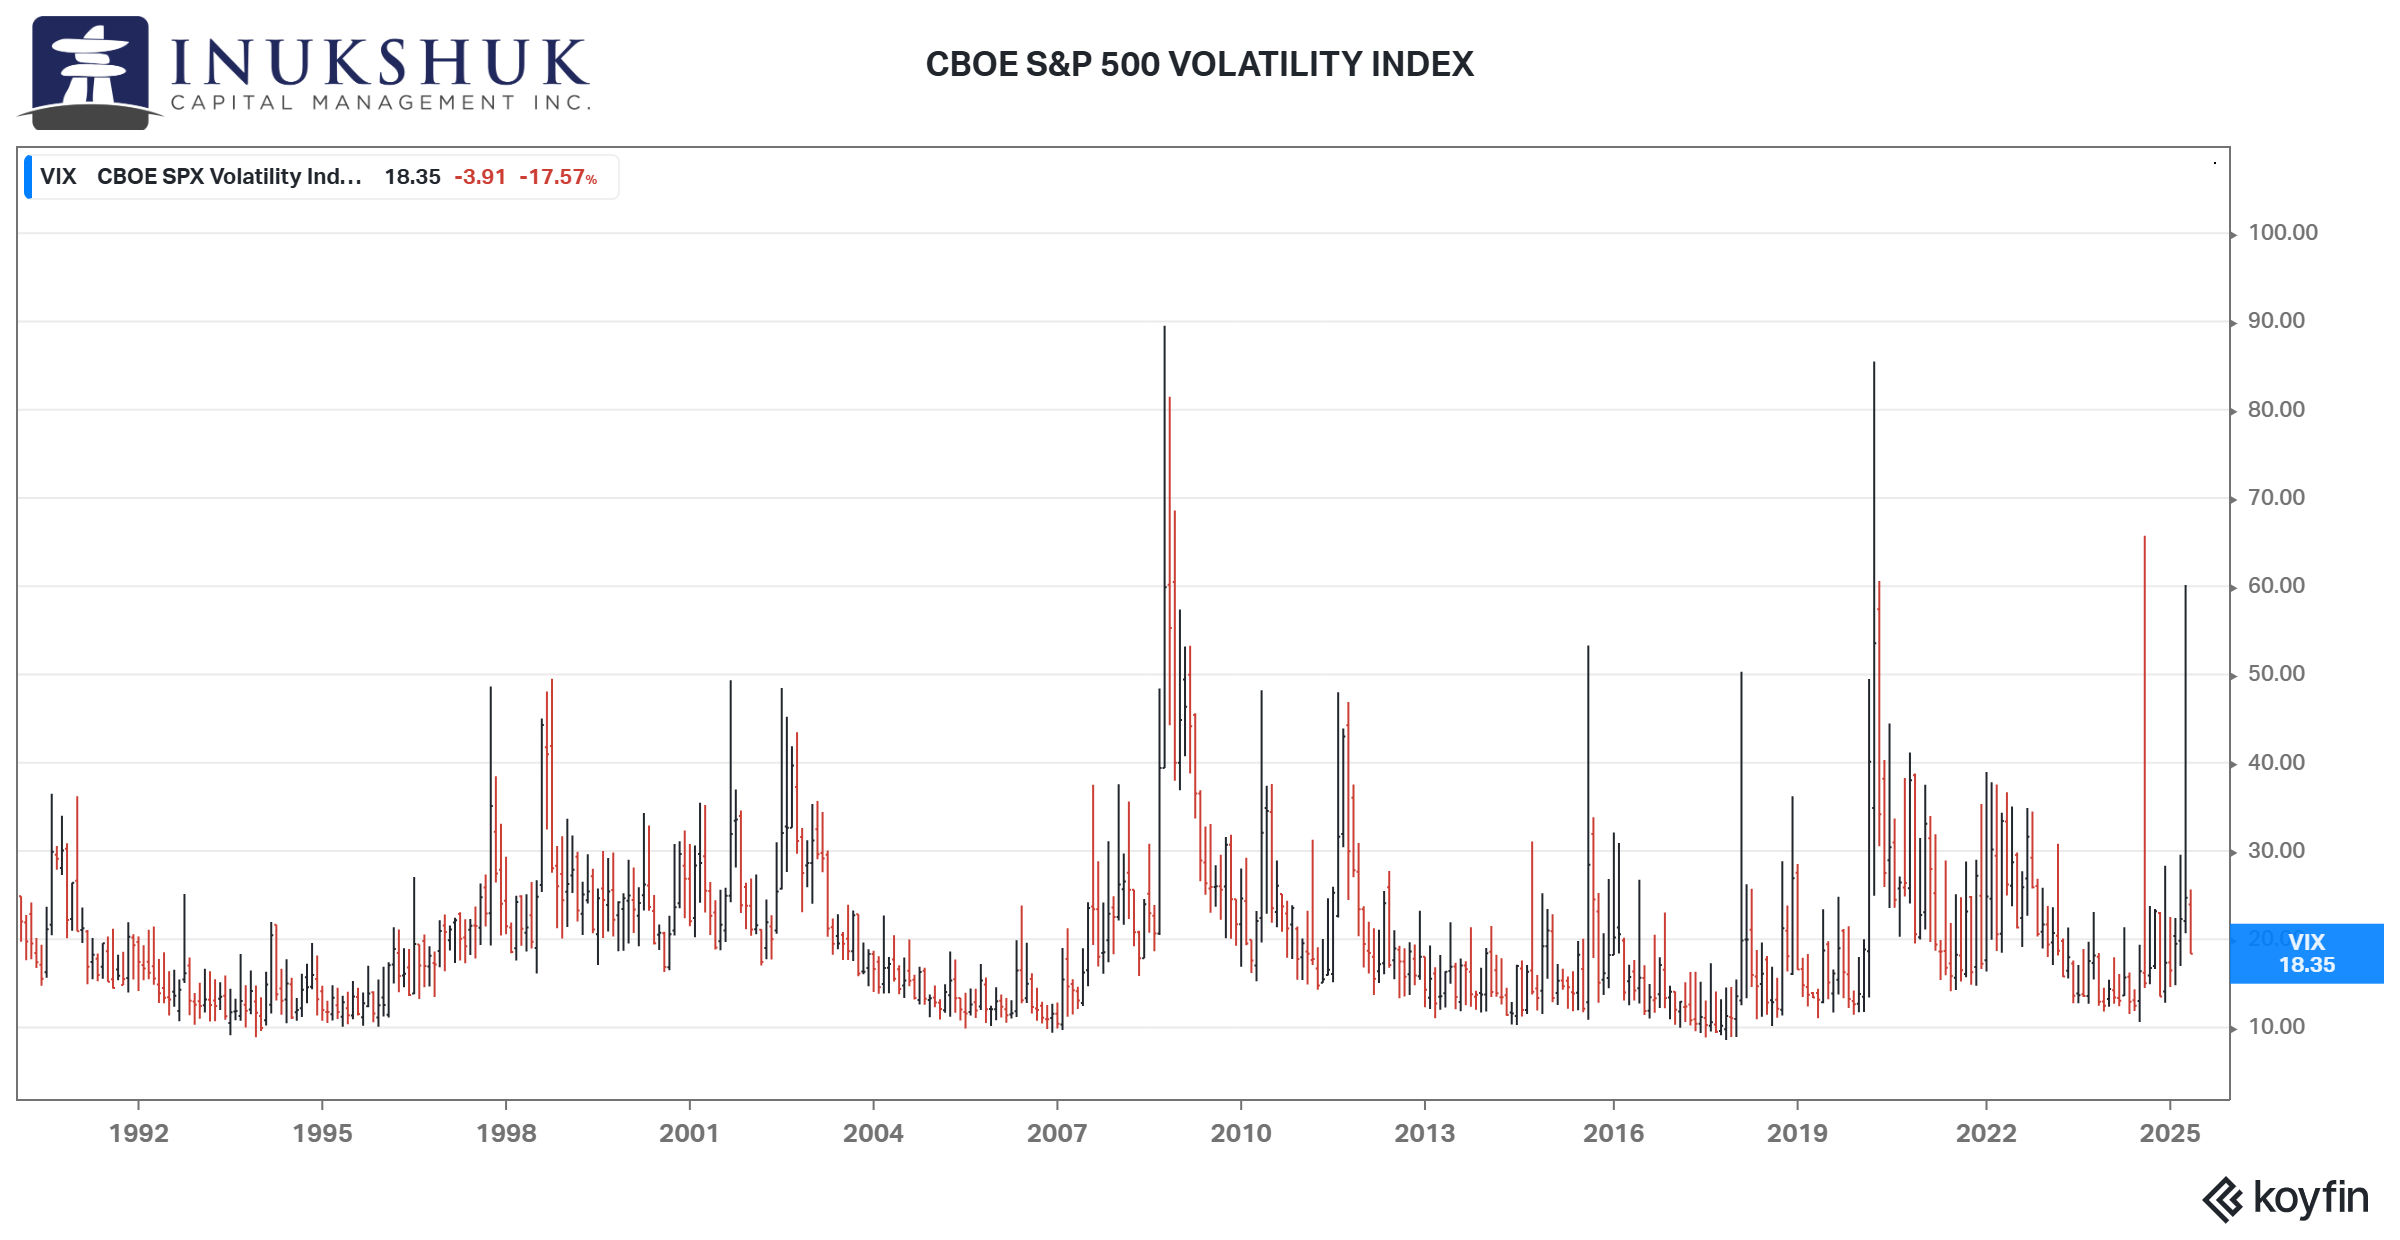
Since its inception in 1990 the average price of the VIX is around 20. You can see when the market is under stress that price spikes. During the GFC it hit 90. In 2020 it peaked over 80. So far this year it has touched 60.
In the past 35 years it has doubled from its average of 20, 13 times. In other words, about every three years the stock market has a moment of panic. April was almost on the podium, just losing out to August of last year.
Fear happens. In general, it fades over time. So, while being painful on a day-to-day basis there is a more concerning risk. That risk is about time. This is particularly important for those nearing retirement or already retired. Markets will fall and can do so in dramatic fashion. How long they stay down is what matters most.
That’s one of the reasons one of our preferred measures of risk is drawdown.
Drawdowns
The peak-to-trough measure is a simple way to understand how much a security or strategy can lose. It can also be used to calculate how fast you can lose money, for how long and how long it takes to get it back.
In the following analysis we use the Dow because the data goes back to 1896. More data is always better in this line of business.
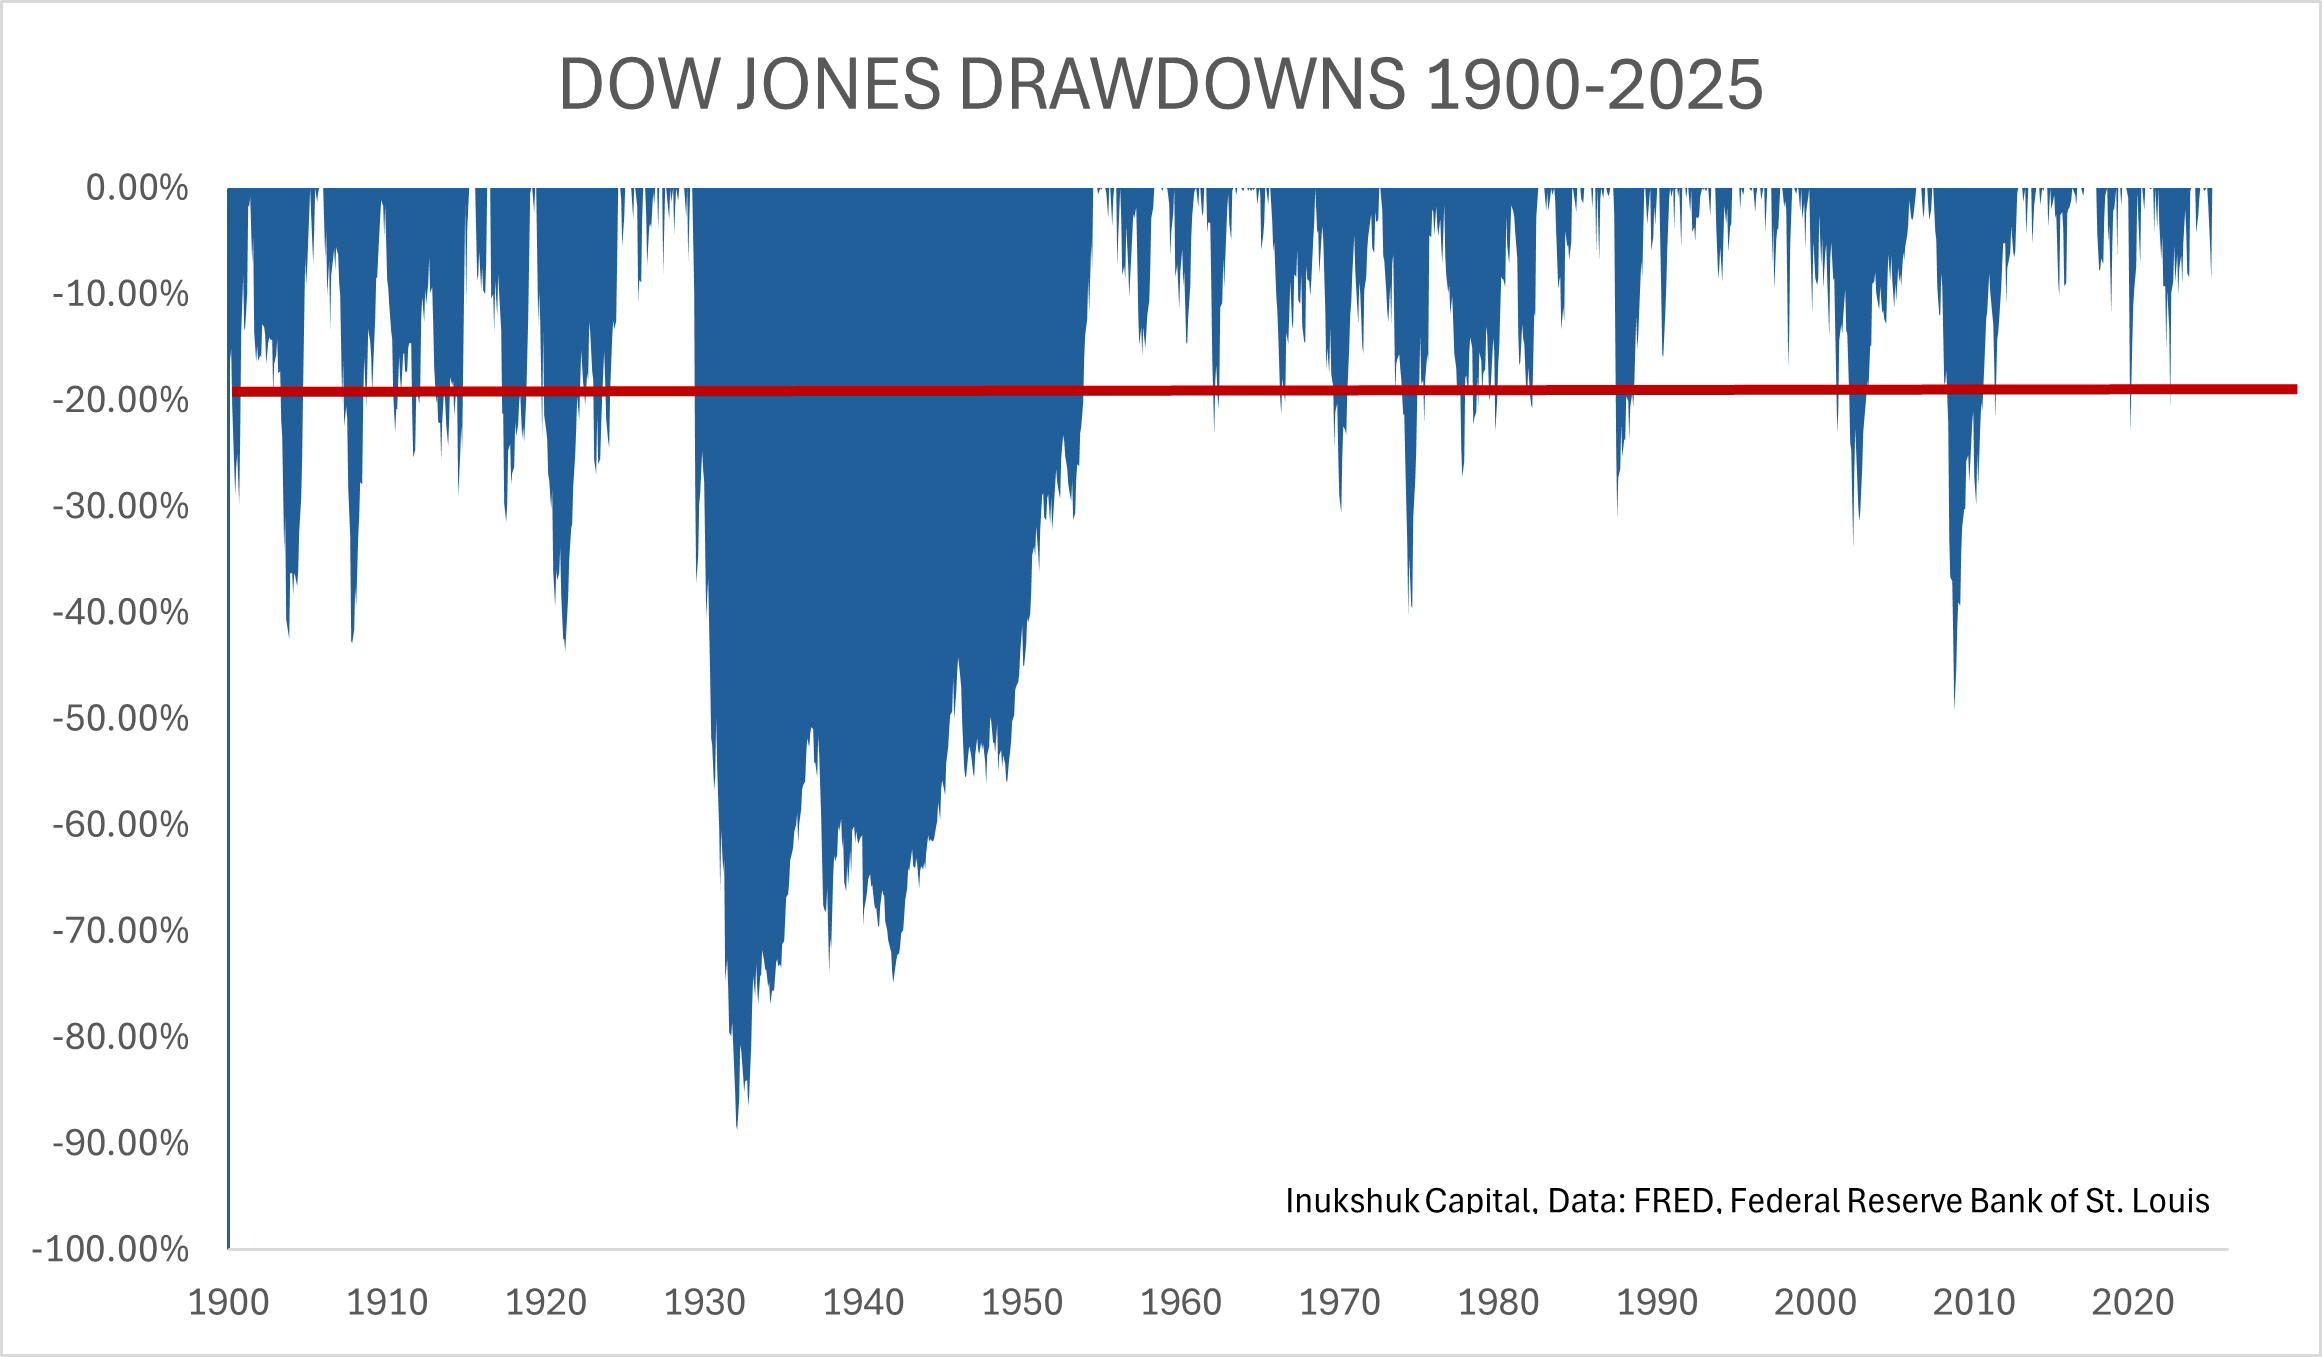
The red line is minus 20%. That is often used as a measure of when a market is in a correction. It’s not really derived from anything quantitative, but it is something people can grasp.
The GFC is dwarfed by the crash of the 1930s. That drawdown was 88% and nothing like it has happened since.
From inception, the Dow has had 15 drawdowns of 20% or more. Since 2000 there have been four instances of drawdowns more than 20%. Let’s look at the length of those.
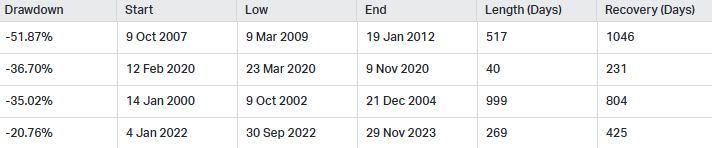
2020 stands out. A 40-day 36.7% loss and less than a year to recover. The GFC was orders of magnitude larger and longer.
These things happen. Being aware of it is important. You can’t manage risk if you don’t know what it is.
Wrapping Up
April’s bronco-like ride, with the S&P 500 swinging from an 11% drop to near flat, shows markets can be a beast. Our systems, now in caution-mode, try to tame that volatility with data-driven signals, not gut reactions. Volatility like this is normal—history shows it—and sticking to a plan is the process.
In last month’s note we looked at the imperfect process of diversification. April was a test. Bonds didn’t really do much, but gold was up 5% and bitcoin 9%. Two out of three ain’t bad.
As Corb Lund sings in ‘Ranchin’, Ridin’, Romance (Two Outta Three Ain’t Bad)’
Yeah, ranchin’, ridin’, romance
Boy don’t look so sad
A man ain’t got but two hands
So just do the best you can…
Ranch, and ride, and romance
Well, two out of three ain’t bad
We do the best we can to worry about risk, so our investors don’t have to.
Enjoy the long weekend.
Have a question? Contact us here
Challenging the status quo of the Canadian investment industry.